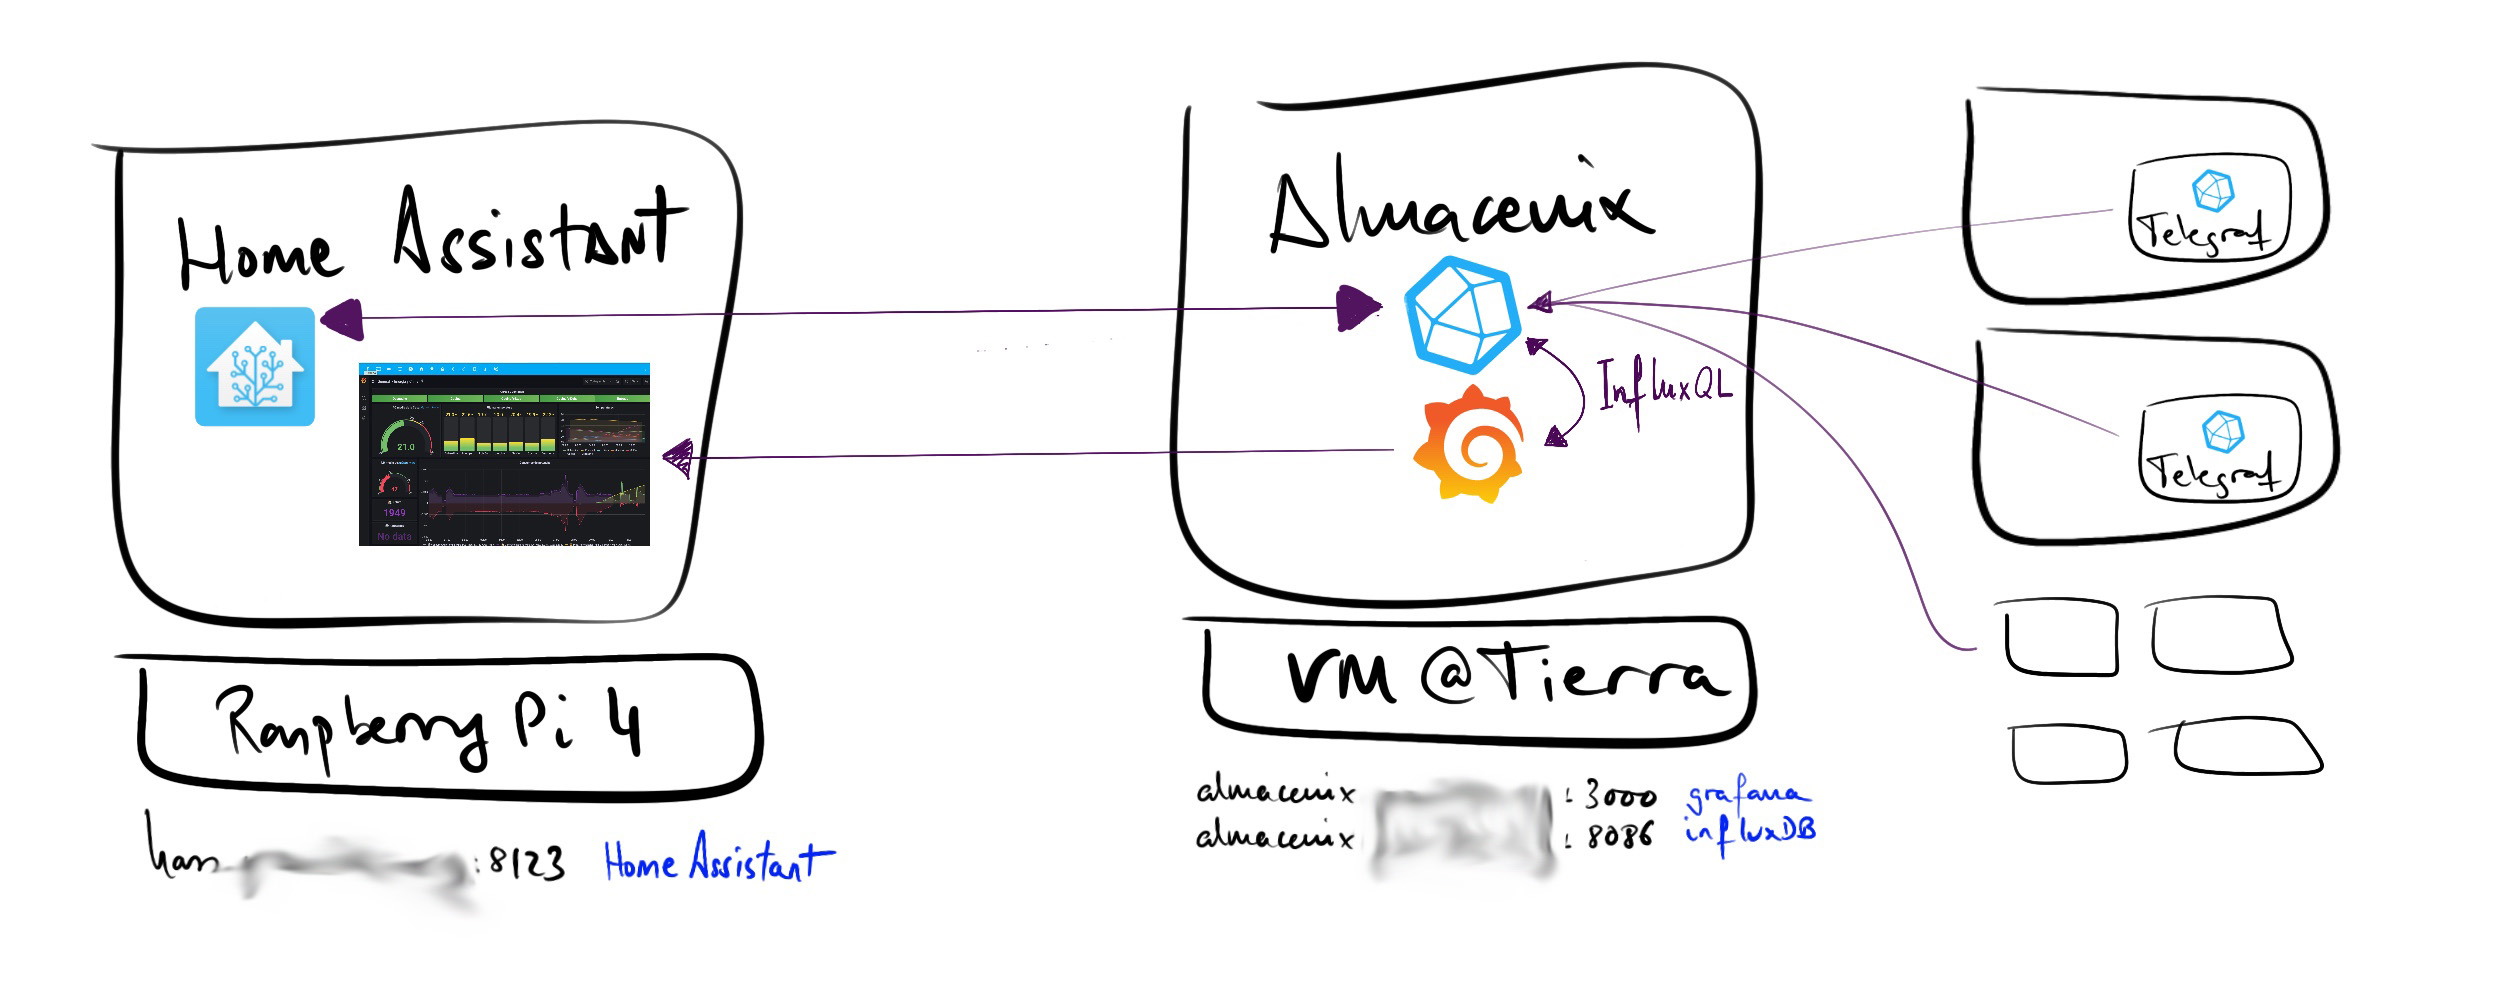
I set up these three services on a dedicated server at home to monitor my home automation. InfluxDB is a database super-optimized for working with time series. Grafana lets you create dashboards and graphs from multiple sources, and Telegraf is a lightweight agent that collects, processes, and sends data to our database.
I’ve decided to install all three on an Ubuntu 20.04 LTS server, on a virtual machine in KVM, so they’re consumed by the rest of the home automation elements: the Home Assistant server and other devices that can write to InfluxDB.
| Note: I previously had Grafana/InfluxDB “inside” Home Assistant OS. Once I finished the installation, I proceeded to migrate the InfluxDB data and Grafana dashboards |
Linux Server Installation
I install Ubuntu on a virtual machine running on KVM. I followed the official documentation, Ubuntu Installation and the following ISO image:
wget https://releases.ubuntu.com/20.04/ubuntu-20.04.3-live-server-amd64.iso
From my KVM server I launch virt-manager > New virtual machine, I use the ISO above and name the server almacenix.tudominio.com (the domain is private, served by my own DNS Server)
Install InfluxDB OSS Server
Once I have Linux operational, I use the reference documentation for InfluxDB 2.1, with downloads here and perform the installation.
wget -qO- https://repos.influxdata.com/influxdb.key | gpg --dearmor | sudo tee /etc/apt/trusted.gpg.d/influxdb.gpg > /dev/null
export DISTRIB_ID=$(lsb_release -si); export DISTRIB_CODENAME=$(lsb_release -sc)
echo "deb [signed-by=/etc/apt/trusted.gpg.d/influxdb.gpg] https://repos.influxdata.com/${DISTRIB_ID,,} ${DISTRIB_CODENAME} stable" | sudo tee /etc/apt/sources.list.d/influxdb.list > /dev/null
apt update && apt upgrade -y
apt full-upgrade -y
apt autoremove -y
apt clean
journalctl --vacuum-time=2d
journalctl --vacuum-size=500M
systemctl reboot -f
- I verify the correct version will be installed:
apt-cache policy influxdb2
influxdb2:
  Instalados: (ninguno)
  Candidato:  2.1.1
  Tabla de versión:
     2.1.1 500
        500 https://repos.influxdata.com/ubuntu focal/stable amd64 Packages
apt install influxdb2
- To prevent it from reporting anything or “phoning home”, I edit
/usr/lib/influxdb/scripts/influxd-systemd-start.sh
/usr/bin/influxd --reporting-disabled &
- I modify
/etc/influxdb/config.tomlso it listens on any IP, making it accessible from the home LAN.
bolt-path = "/var/lib/influxdb/influxd.bolt"
engine-path = "/var/lib/influxdb/engine"
http-bind-address = "0.0.0.0:8086"
- I restart the service
systemctl restart influxdb
InfluxDB Administration
I connect to http://almacenix.tudominio.com:8086 <– Put your name/address here.
I create my user (luis), set the password, and name the Organization “tudominio.com” (can be anything)
I configure and save the
API Tokenfor my user.It’s in Data -> API Tokens -> luis Token - It will be something like:
nC912345678901234567890M4MFFj-abcdefghijklmnopqrstu123847987sadkjhfklj9832498324908123==
| Note: Any client that wants to Read or Write to my InfluxDB will need to know the server URL, the Organization name, the “Bucket” (Database) name, and the API Token! |
- I install the Influx CLI client
wget https://dl.influxdata.com/influxdb/releases/influxdb2-client-2.2.0-linux-amd64.tar.gz
tar xvzf influxdb2-client-2.2.0-linux-amd64.tar.gz
mv influxdb2-client-2.2.0-linux-amd64/influx /usr/local/bin
- I configure the client so it doesn’t ask for the token every time I use it:
luis@almacenix:~$ influx version
Influx CLI 2.2.0 (git: c3690d8) build_date: 2021-10-21T15:24:59Z

luis@almacenix:~$ influx config create --config-name influxdb-almacenix  --host-url http://<your-url>:8086 --org <your org>  --token <your token> --active

luis@almacenix:~$ cat .influxdbv2/configs
[influxdb-almacenix]
  url = "http://almacenix.tudominio.com:8086"
  token = "nC912345678901234567890M4MFFj-abcdefghijklmnopqrstu123847987sadkjhfklj9832498324908123=="
  org = "tudominio.com"
  active = true

Proof of concept
luis@almacenix:~$ influx user list
ID   Name
08e1234567892000 luis
- I configure the InfluxDB client on my MacOS.
$ brew update
$ brew install influxdb
$ influx config create --config-name influxdb-almacenix  --host-url http://<your-url>:8086 --org <your org>  --token <your token> --active

Proof of concept
$ influx user list
ID   Name
08e1234567892000 luis
Creating my databases
I’m going to use this server to receive data from Telegraf clients and from Home Assistant, so I create a couple of Buckets.
telegraf, with retentionnever or infinitehome_assistant, with retentionnever or infinite
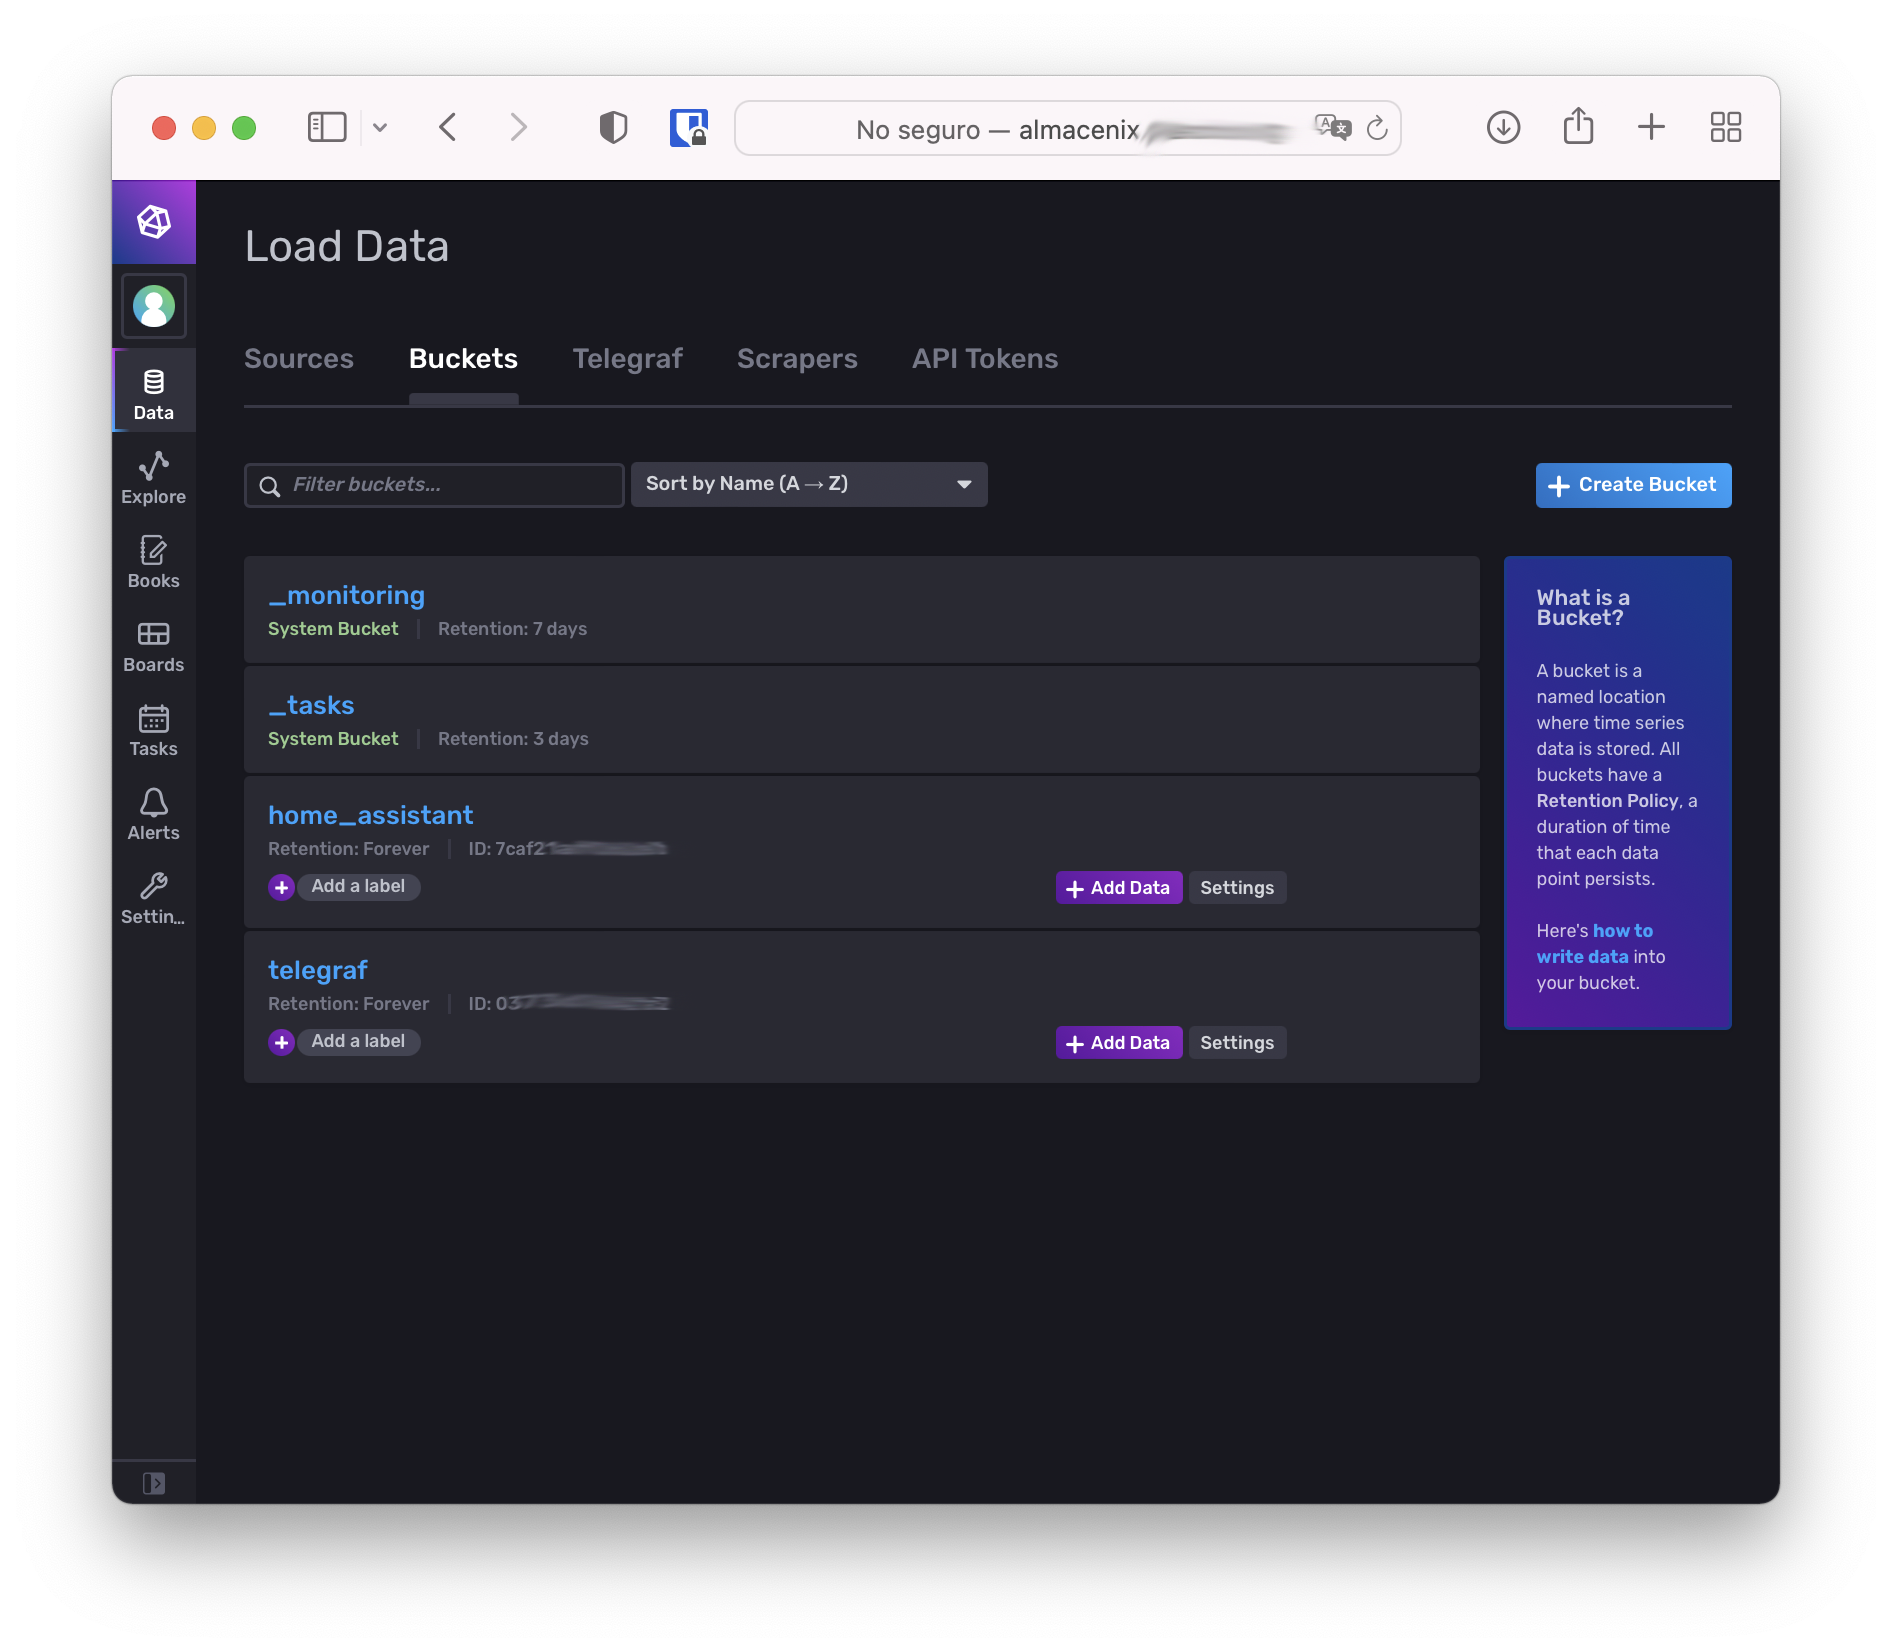
| Note: I use the same name (home_assistant) as the one used in Home Assistant’s InfluxDB to facilitate the later migration, documented in this post. |
Installing the Telegraf client on Linux Ubuntu/Debian/Raspbian
I repeat the following on several Linux machines, starting with almacenix. I start from the version 2.1 guide
- Reference: Use Telegraf to write data
- Reference: Install Telegraf
root@almacenix:~# apt-cache policy telegraf
telegraf:
  Instalados: (ninguno)
  Candidato:  1.21.3-1
  Tabla de versión:
     1.21.3-1 500
        500 https://repos.influxdata.com/ubuntu focal/stable amd64 Packages
root@almacenix:~# apt install telegraf

systemctl stop telegraf
- From InfluxDB http://almacenix.tudominio.com:8086
- Data > Buckets > Create Bucket > ’telegraf’, retention ’never'
- Data > Telegraf > Create Configuration > Bucket ’telegraf’ > System > Continue >
- Create and verify.
- I copy the Token and URL to read the configuration from the InfluxDB server itself
- The configuration is in Data>Telegraf>Telegraf Almacenix>Download
I create a custom version of the telegraf.service, modify it, and start the service
cp /lib/systemd/system/telegraf.service /etc/systemd/system/
nano telegraf.service
   ExecStart=/usr/bin/telegraf --config http://almacenix.tudominio.com:8086/api/v2/telegrafs/XXXXXXXX $TELEGRAF_OPTS
systemctl daemon-reload
nano /etc/defaults/telegraf
  INFLUX_TOKEN=XXXXXXXXX==
systemctl daemon-reload
systemctl start telegraf
Installing the Telegraf client on Linux Gentoo
I have a couple of routers based on Gentoo. It’s important that Layman is set up before doing the following. Telegraf is not in the portage tree, emerge from overlay:
Here's someone who maintains it... as an overlay
    - https://github.com/aexoden/gentoo-overlay

Create /etc/portage/repos.conf/gentoo-aexoden.conf
[gentoo-extras-overlay]
location = /var/db/repos/gentoo-extras-overlay
sync-type = git
sync-uri = https://github.com/aexoden/gentoo-overlay.git
clone-depth = 0
auto-sync = yes

emerge --sync
cat >> /etc/portage/package.accept_keywords
net-analyzer/telegraf ~amd64

emerge -v telegraf
- From InfluxDB http://almacenix.tudominio.com:8086
- Data > Telegraf > Create Configuration > Bucket ’telegraf’ > System > Continue >
- Create and verify.
- I copy the Token and URL
- The configuration is in Data>Telegraf>Telegraf Almacenix>Download
I create a custom version of the telegraf.service, modify it, and start the service
cp /lib/systemd/system/telegraf.service /etc/systemd/system/
nano telegraf.service
 EnvironmentFile=-/etc/conf.d/telegraf
 ExecStart=/usr/bin/telegraf --config http://almacenix.tudominio.com:8086/api/v2/telegrafs/XXXXXXXXX $TELEGRAF_OPTS
systemctl daemon-reload
nano /etc/conf.d/telegraf
 INFLUX_TOKEN=XXXXXXX==
systemctl daemon-reload
systemctl start telegraf
Install Grafana OSS Server
- I follow the guide Install on Debian or Ubuntu
apt install -y apt-transport-https software-properties-common wget
wget -q -O - https://packages.grafana.com/gpg.key | sudo apt-key add -
echo "deb https://packages.grafana.com/oss/deb stable main" | sudo tee -a /etc/apt/sources.list.d/grafana.list
apt update
apt install grafana
systemctl daemon-reload
systemctl start grafana-server
systemctl status grafana-server
systemctl enable grafana-server
Configure Grafana
From a browser I connect to the new Grafana server and perform the initial configuration.
I connect to http://almacenix.tudominio.com:3000 –> admin, admin (I change the password)
I connect to my two InfluxDB Buckets (
telegrafandhome_assistant)
Data Sources -> Add data source

Name: Flux telegraf
 Query Language: Flux
 URL: http://127.0.0.1:8086
 Access: Server
 Auth: Everything disabled
 InfluxDB Details:
    Organization: tudominio.com (yours)
    Token: <The one you set with your main user>
    Default Bucket: telegraf
 SAVE & TEST -> Ok

Data Sources -> Add data source

Name: Flux home_assistant
 Query Language: Flux
 URL: http://127.0.0.1:8086
 Access: Server
 Auth: Everything disabled
 InfluxDB Details:
    Organization: tudominio.com (yours)
    Token: <The one you set with your main user>
    Default Bucket: home_assistant
 SAVE & TEST -> Ok
The recommended language for querying InfluxDB 2.x is
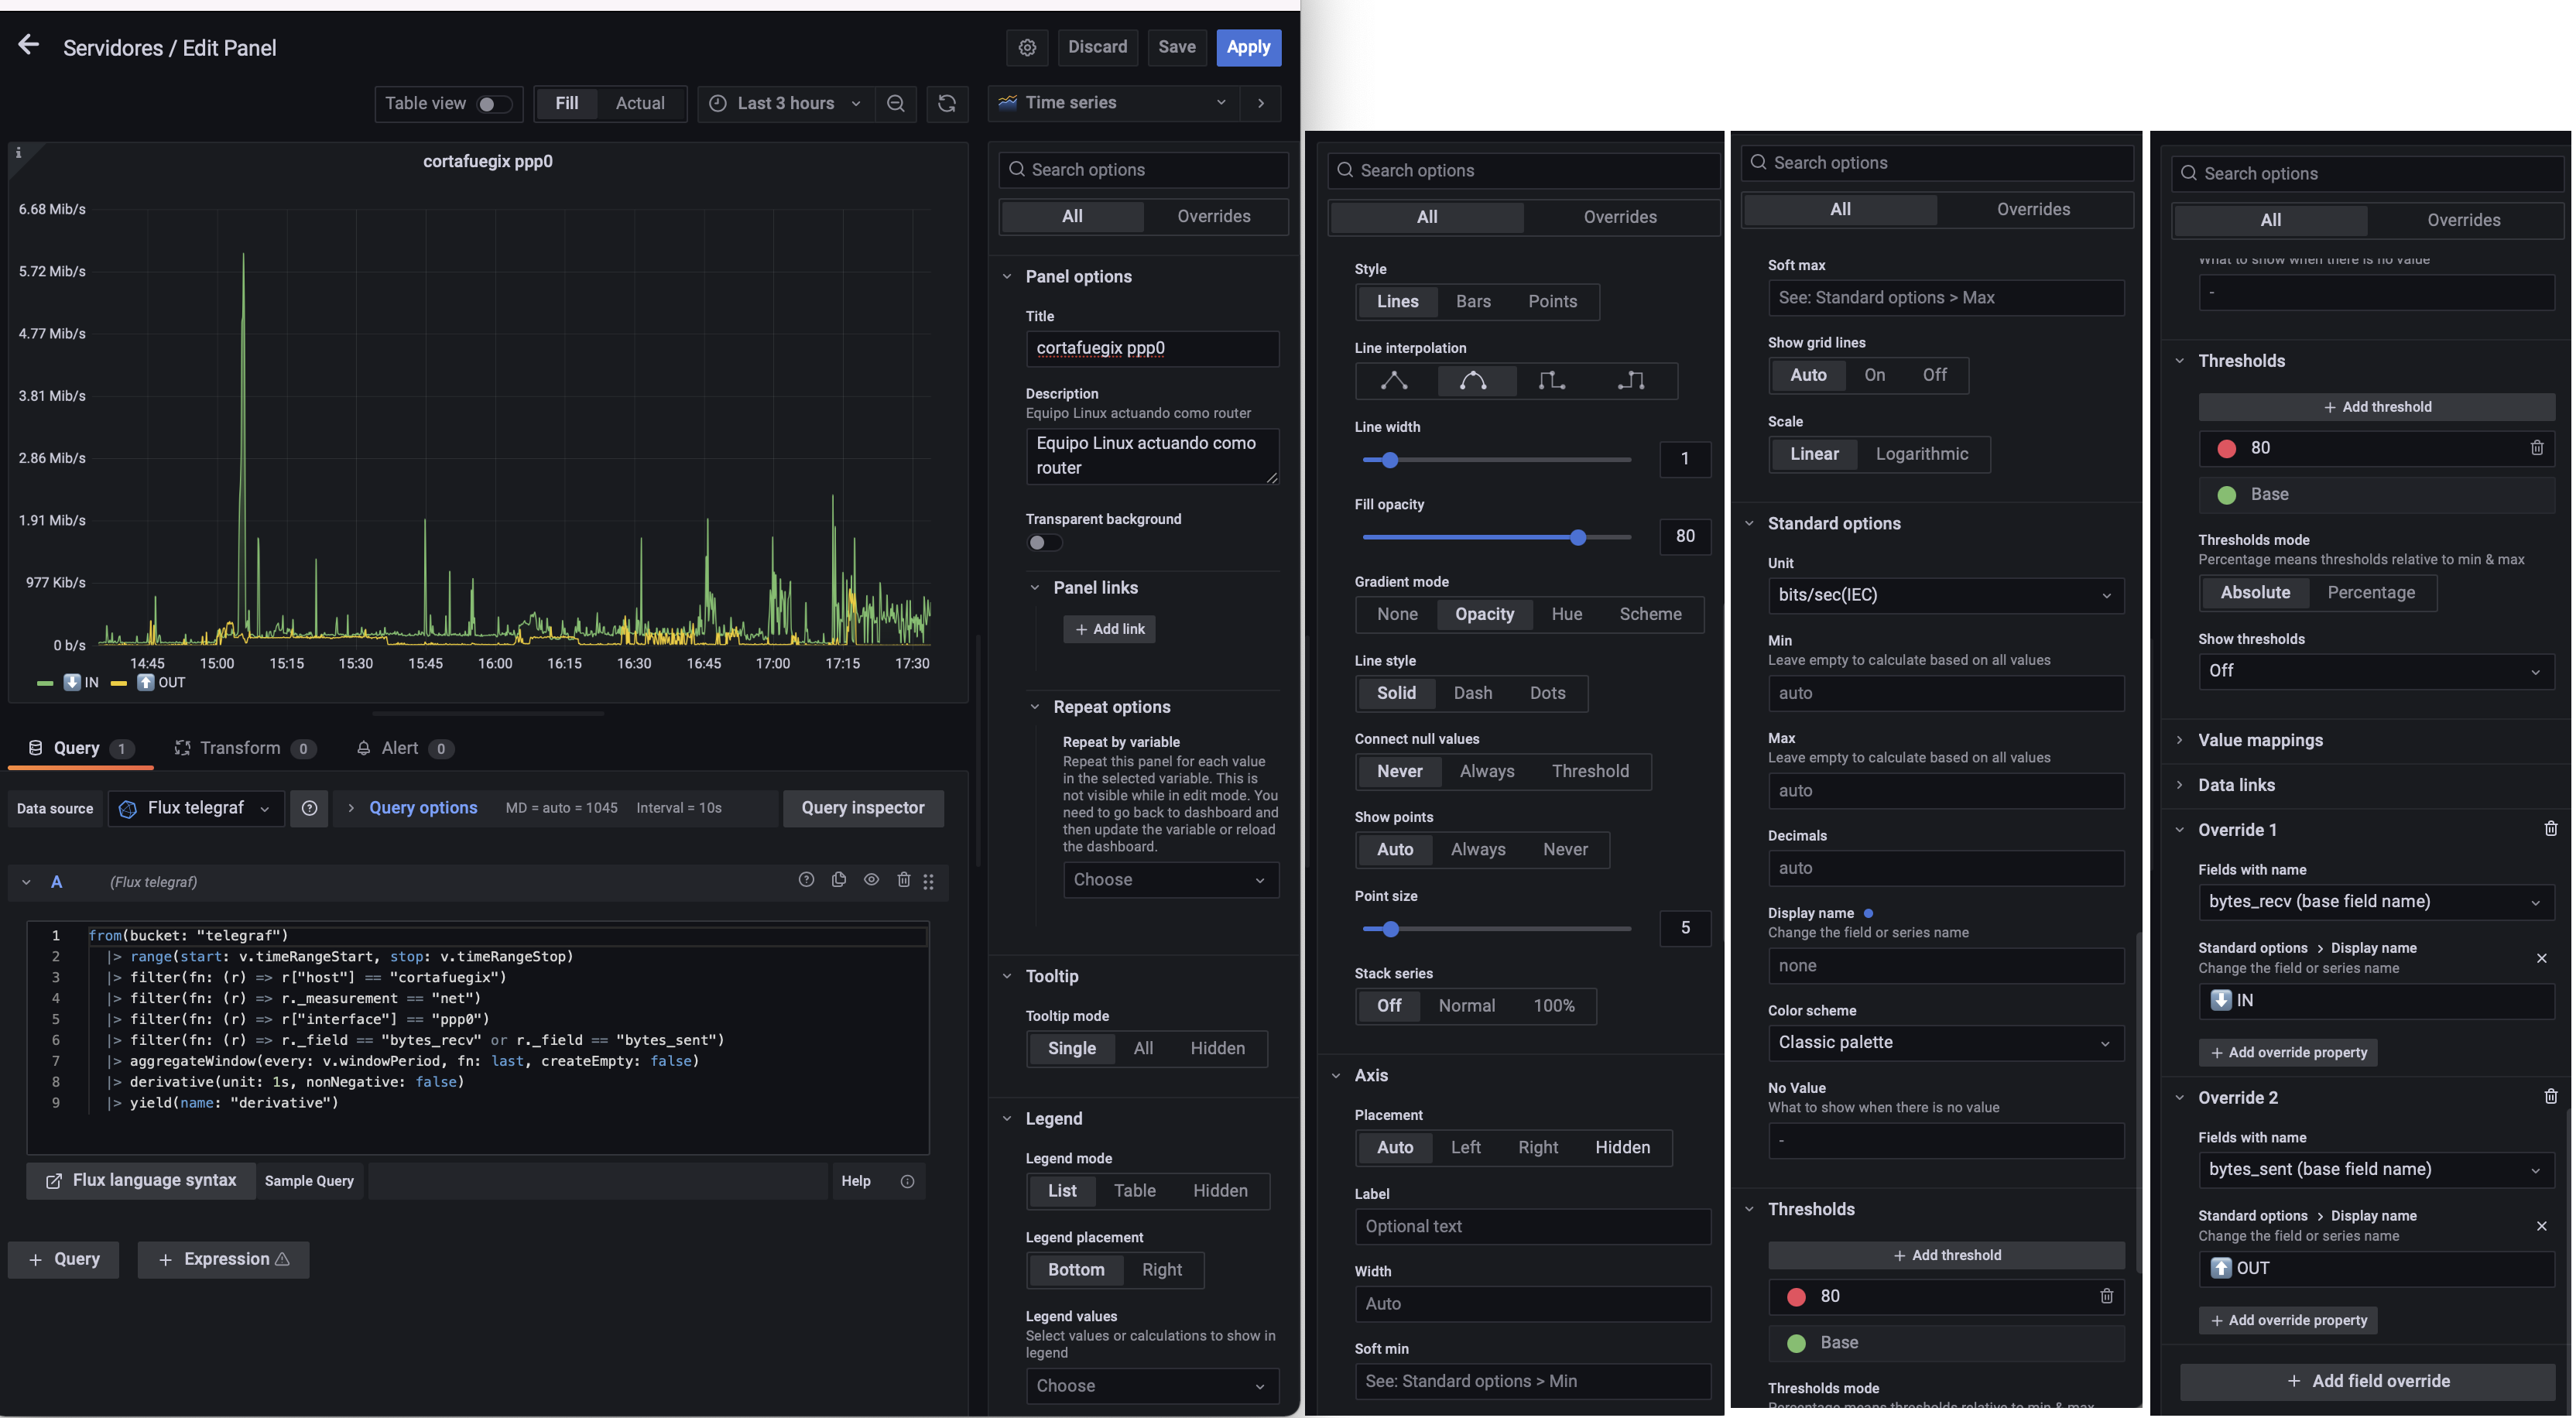
Fluxas opposed toInfluxQL(version 1.x). It’s a scripting language that allows much more complex queries, advanced programming, etc. It’s quite different from the familiar SQL, so it takes some getting used to. Here’s an example (you’ll find more in the migration post)Panel to measure network traffic from a Telegraf client (one of my Linux machines):
from(bucket: "telegraf")
  |> range(start: v.timeRangeStart, stop: v.timeRangeStop)
  |> filter(fn: (r) => r["host"] == "cortafuegix")
  |> filter(fn: (r) => r._measurement == "net")
  |> filter(fn: (r) => r["interface"] == "ppp0")
  |> filter(fn: (r) => r._field == "bytes_recv" or r._field == "bytes_sent")
  |> aggregateWindow(every: v.windowPeriod, fn: last, createEmpty: false)
  |> derivative(unit: 1s, nonNegative: false)
  |> yield(name: "derivative")
Grafana Tips
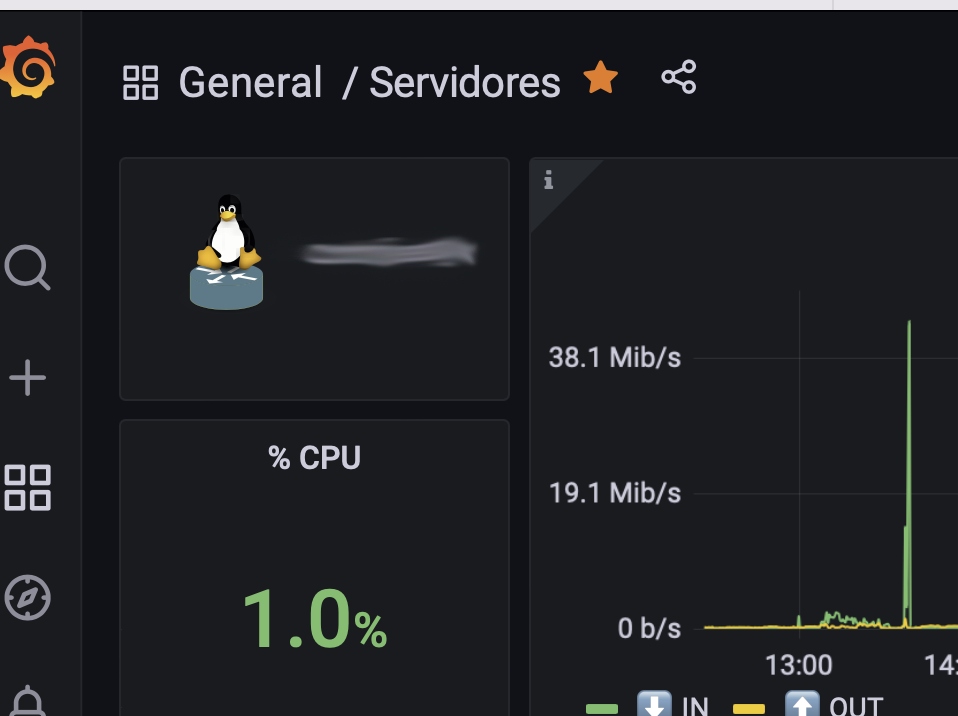
Display an image in a Grafana panel
- Copy the image to root@your_server:/usr/share/grafana/public/img/
- Reference the file from a Text type Panel with HTML/MD content, in my case I use HTML to center it:
<center>
<img src="/public/img/logo-linux-router.svg" alt="logo-linux-router.svg" width="64"/>
cortafuegix
</center>
Share Dashboard with a remote Home Assistant
I like to see Grafana dashboards from Home Assistant as integrated as possible:
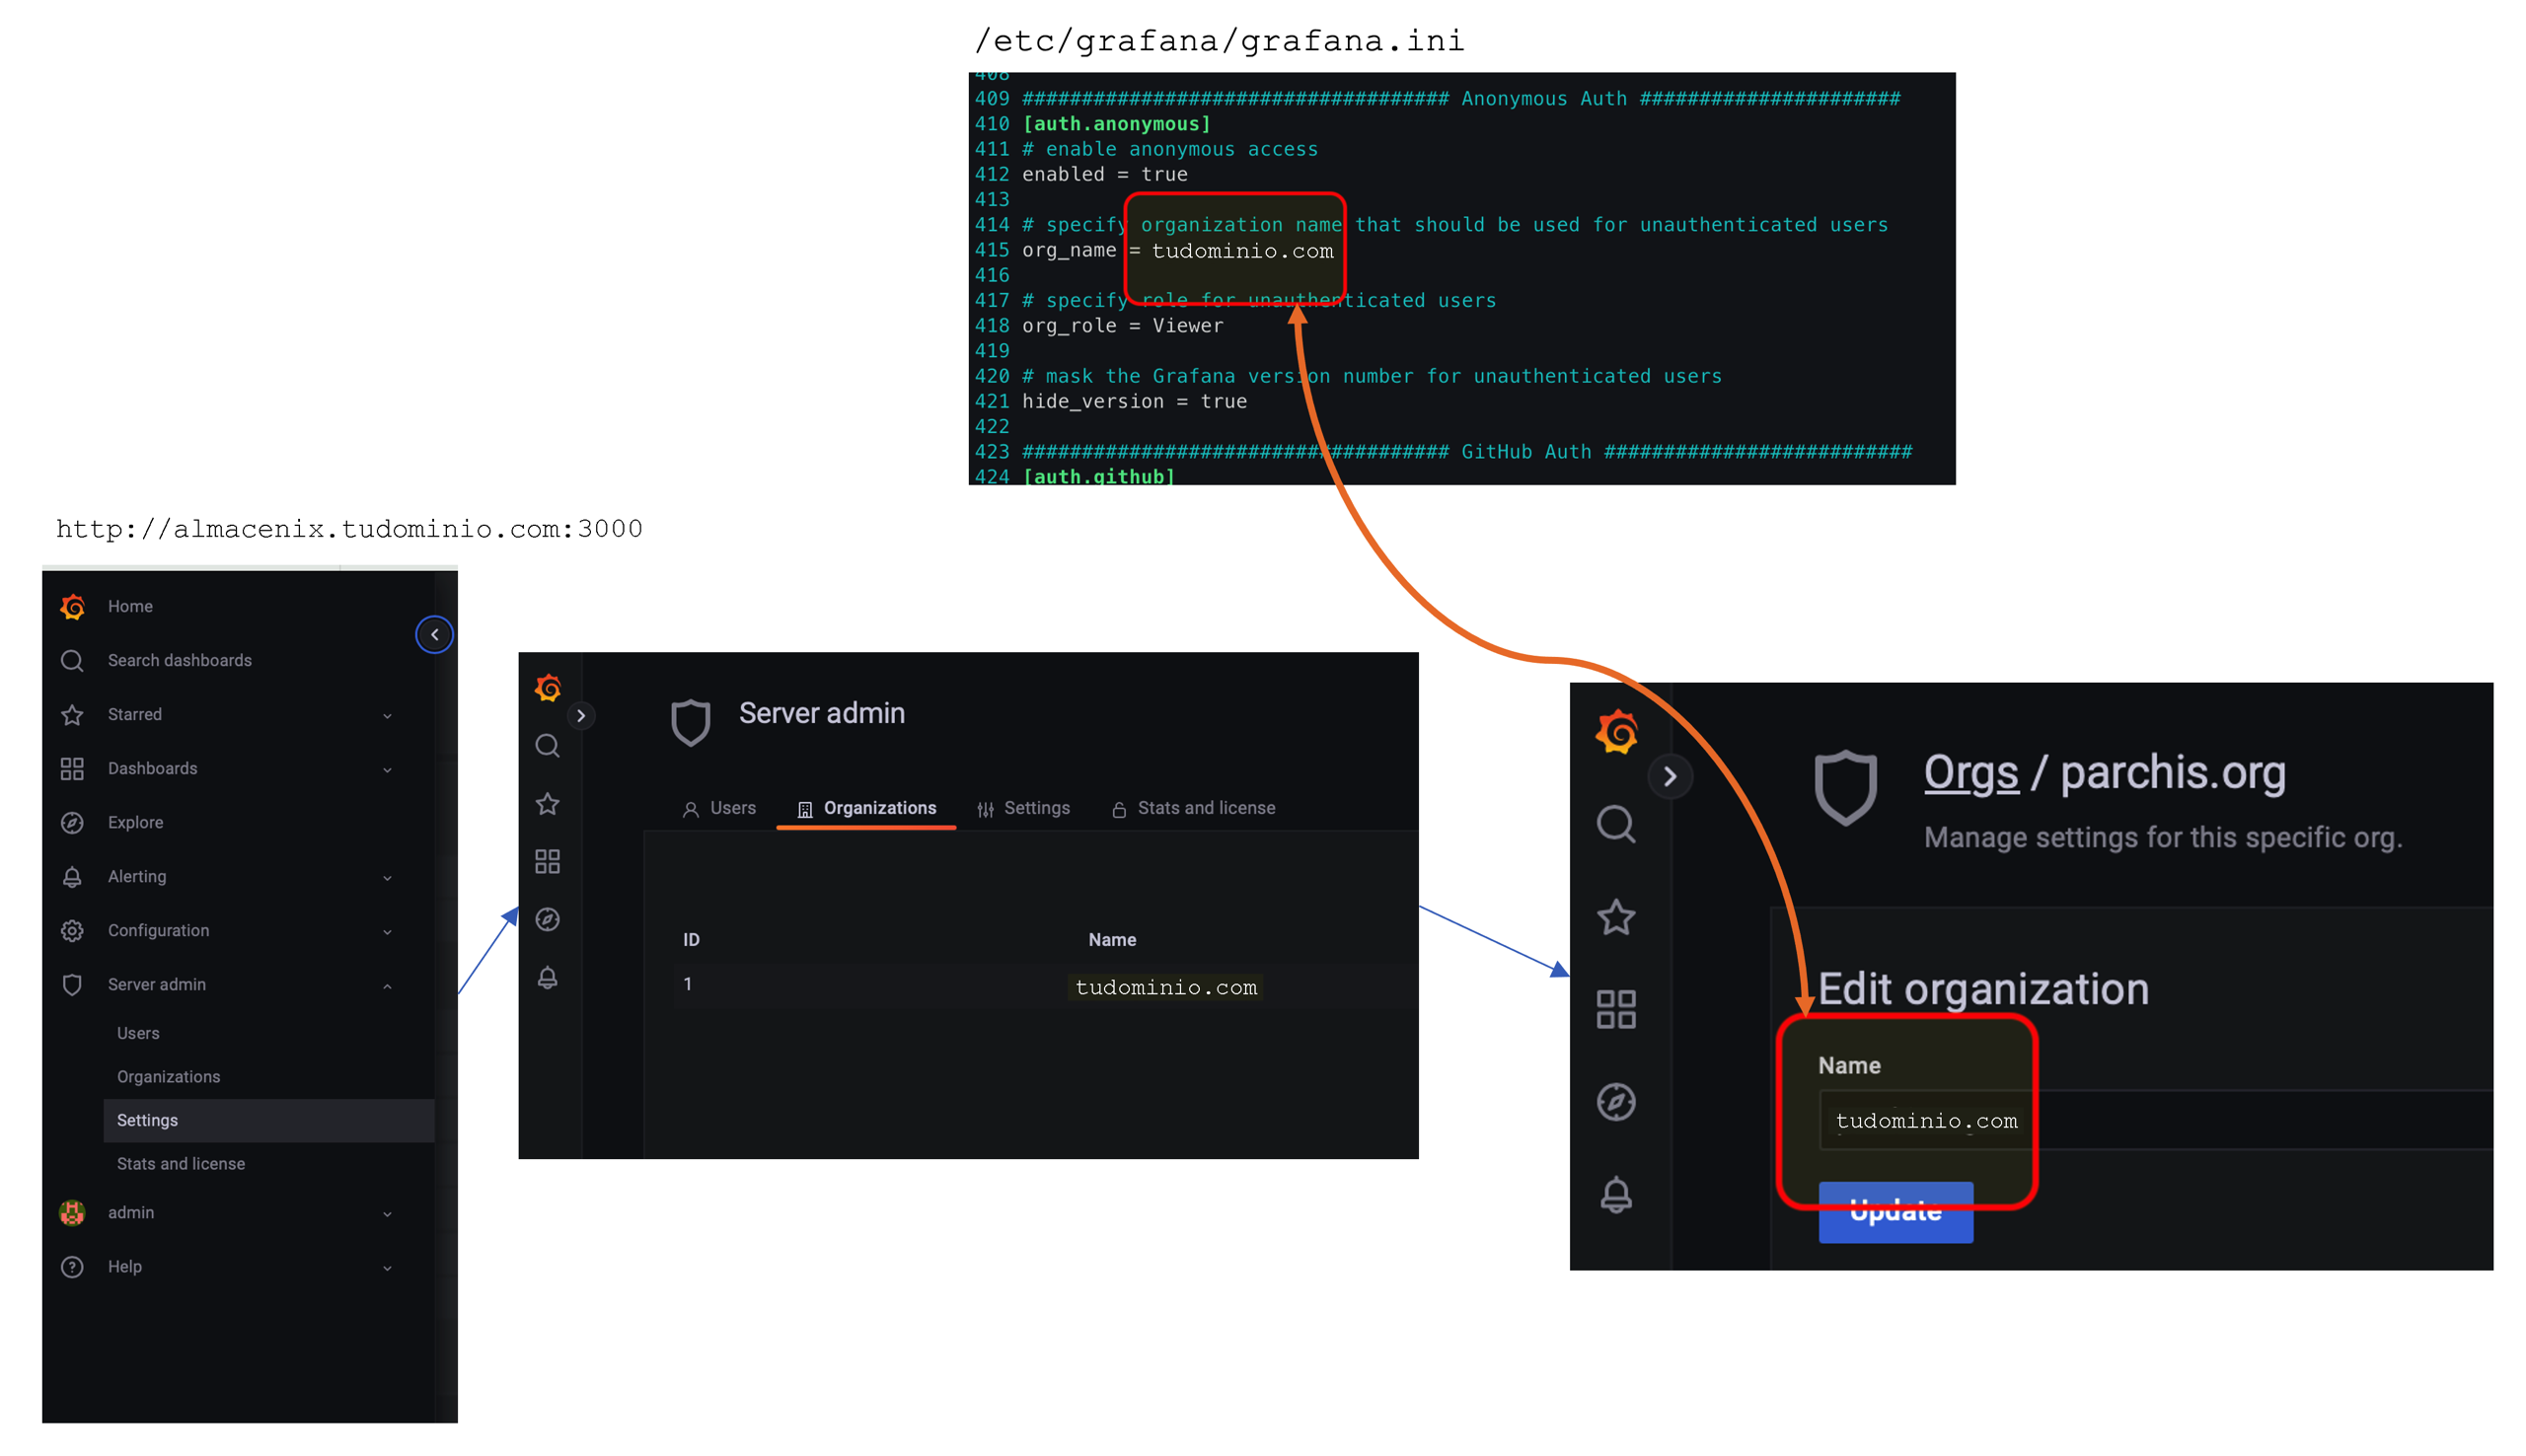
- I configure anonymous authentication and the ability to work with iFrames by modifying the file
/etc/grafana/grafana.ini:
[auth.anonymous]
enabled = true
org_name = tudominio.com
org_role = Viewer
hide_version = true

[security]
cookie_samesite = none
allow_embedding = true
- I restart the Grafana server:
root@almacenix:~# systemctl restart grafana-server.service
- Next I make sure the
org_name(grafana.ini) matches the Organization name. I enter the Grafana web administration and make sure they match:
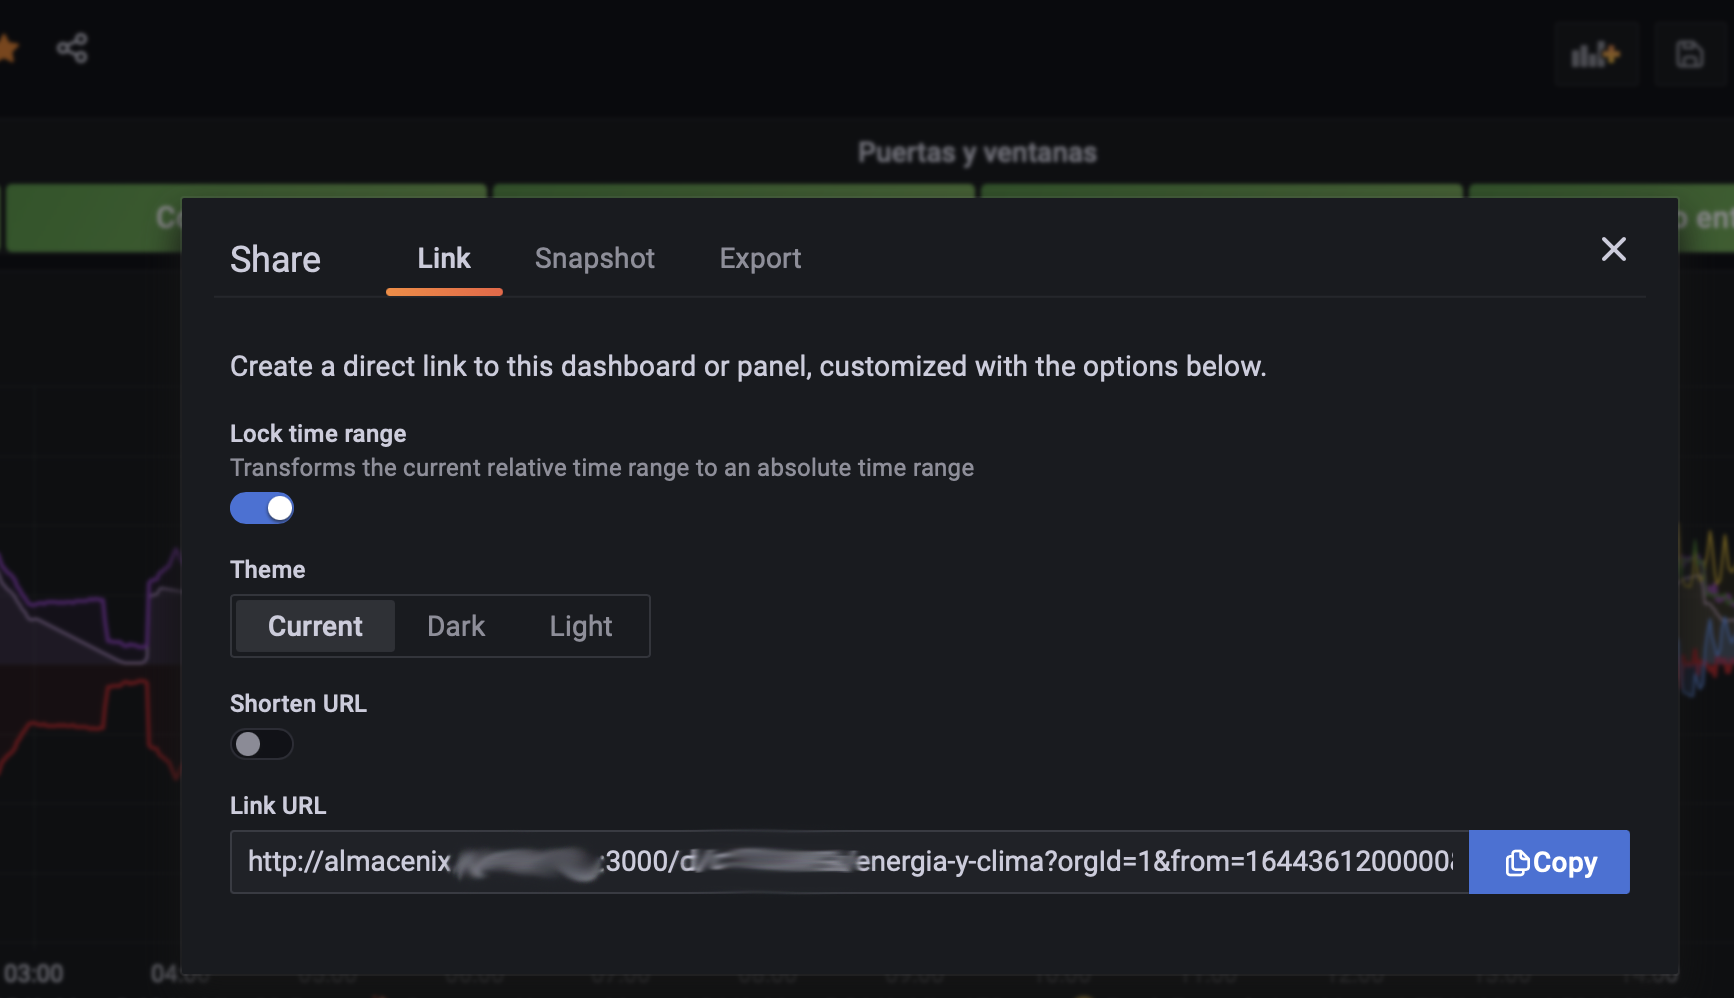
- Finally, we just need to copy the direct link to the Dashboard.
- From Grafana->Dashboard->Open the dashboard->Click the Share icon!
- Copy the URL
- In Home Assistant
- On an existing Dashboard or creating one from Configuration->Dashboards.
- Edit Dashboard
- Add view, set a name, Save and Add Card, type iFrame (Web page Card)
- Enter the Code Editor and add the following, editing to taste (change the URL to yours)
type: iframe
url: >-
  http://almacenix.tudominio.com:3000/d/123456-nk/servidores?orgId=1&from=now/d&to=now&kiosk=tv&refresh=5s
aspect_ratio: 70%
- Save
- Edit the View again (not the Card) and in View Type set “Panel (1 card)”
Remember, here’s a post about how to migrate InfluxDB data and Grafana dashboards from Home Assistant to a new server like the one we just configured.
InfluxDB Tips
Export all data from a bucket
I wanted to see how Telegraf data was being stored, so I exported it from influx to inspect
luis@almacenix:~$ influx bucket list
ID   Name  Retention Shard group duration Organization ID  Schema Type
:
1234584375938475 telegraf infinite 168h0m0s  8975ef952db592e6 implicit
:
luis@almacenix:~$ sudo influxd inspect export-lp --bucket-id 1234584375938475 --engine-path /var/lib/influxdb/engine --output-path /home/luis/telegraf.lp
:
luis@almacenix:~$ more telegraf.lp
cpu,cpu=cpu-total,host=almacenix usage_guest=0 1644238720000000000
cpu,cpu=cpu-total,host=almacenix usage_guest=0 1644238730000000000
cpu,cpu=cpu-total,host=almacenix usage_guest=0 1644238740000000000
cpu,cpu=cpu-total,host=almacenix usage_guest=0 1644238750000000000
:
Delete specific data
During testing with Telegraf Plugins I generated a lot of data that I later wanted to delete. Here are some examples:
- Delete everything stored with
_measurement="temporal_size"between two specific timestamps
luis@almacenix:~$ influx delete --bucket telegraf --start '2022-02-15T17:00:00Z' --stop '2022-02-15T23:00:00Z' --predicate '_measurement="temporal_size"'
- Repeat but use “right now” as the end date.
luis@almacenix:~$ influx delete --bucket telegraf --start '2022-02-16T14:00:00Z' --stop $(date +"%Y-%m-%dT%H:%M:%SZ") --predicate '_measurement="temporal_size"'
- Delete
_measurement="temporal_size"completely. Some tests were stored with dates in the past, so I set it to delete everything from the beginning of (digital) time until now…
luis@almacenix:~$ influx delete --bucket telegraf --start '1970-01-01T00:00:00Z' --stop $(date +"%Y-%m-%dT%H:%M:%SZ") --predicate '_measurement="temporal_size"'
- Last example: I ran tests with the
inputs.influxdbplugin which filled the Telegraf bucket with dozens of_measurements that were useless to me afterward. I took advantage of the fact that all data points came with a tag calledurl.
luis@almacenix:~$ influx delete --bucket telegraf --start '2022-02-15T01:00:00Z' --stop '2022-02-16T23:00:00Z' --predicate 'url="http://localhost:8086/metrics"'
Telegraf Tips
Monitor the size of InfluxDB server buckets
The goal is to determine the size of InfluxDB server buckets, for example to watch if they grow too much and we run out of space. As always, everything can be observed from Grafana
Gist: Script compatible with influx format for the input.exec Plugin to determine the size of InfluxDB server buckets.
Monitor the size of QCOW2 disks on a QEMU/KVM Host
The goal is to be able to see the size of QCOW2 disks on a Linux Host with QEMU/KVM.
Gist: Script compatible with influx format for the input.exec Plugin to determine the space used by QCOW2 disks.