I describe how I integrated my photovoltaic installation into Home Assistant, featuring Axitec panels, a SolaX Inverter, and a pair of Triple Power batteries. After trying several options, I settled on the MODBUS/TCP integration which works locally via LAN and exposes more data than the other options.
Installation
My photovoltaic installation consists of the following components:
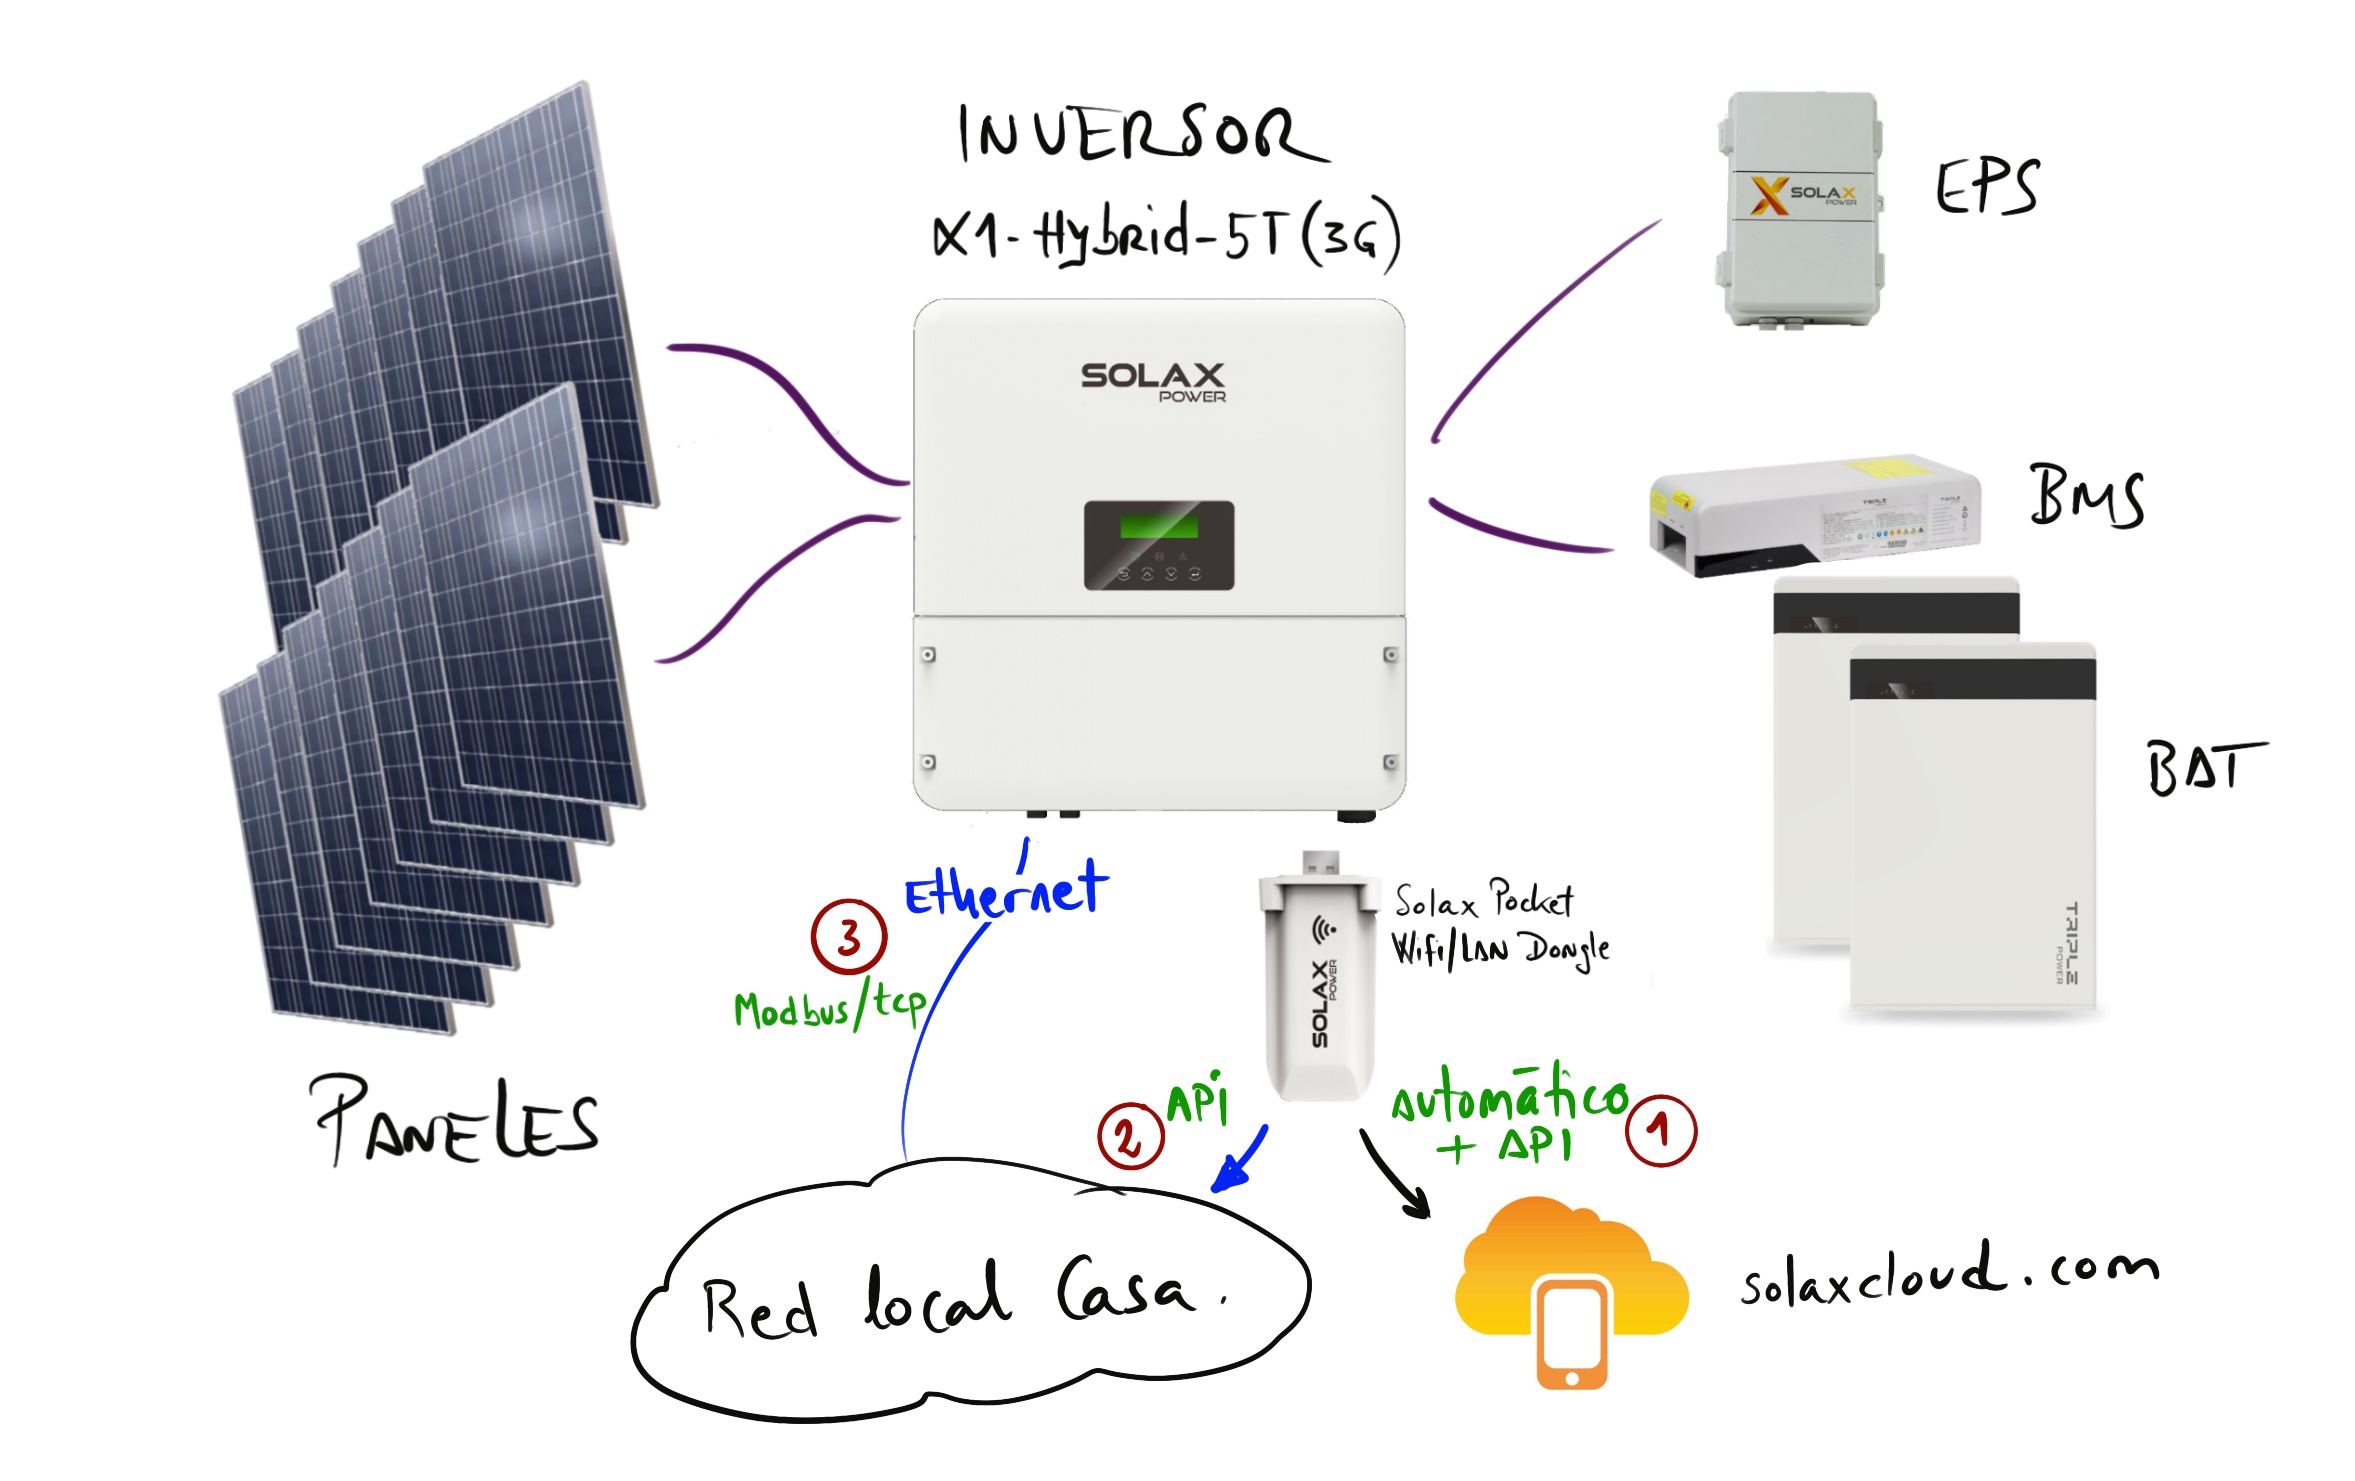
  - 1 x SolaX Hybrid Inverter X1-HYBRID-5.0T Gen-3
  - 23 x Axitec 280W 60-cell polycrystalline solar modules
  - 1 x SolaX EPS Box
  - 1 x BMS for SolaX Triple Power batteries T-BAT MC0500
  - 2 x Triple Power T63 v2.0 SolaX 6.3kWh Battery
  - 1 x Chint DDSU 666 Meter
  - 1 x SolaX Pocket WiFi Dongle
We have three monitoring options:
- SolaX Cloud (automatically updated via the Dongle), which can be queried through the official SolaX App or via REST/API.
- Direct local query to the Pocket WiFi/LAN Dongle via REST/API.
- Direct query over LAN (Ethernet port) via MODBUS/TCP.
1. Monitoring via SolaX Cloud
When the installation is complete, the Dongle should be configured to upload data to SolaX Cloud so you can check it from a browser or mobile app. Updates happen every 5 minutes.
- You can use a browser or the SolaX App to connect to SolaX Cloud. In both cases you’re accessing an online service with a 5-minute window, which, although not real-time, works quite well.
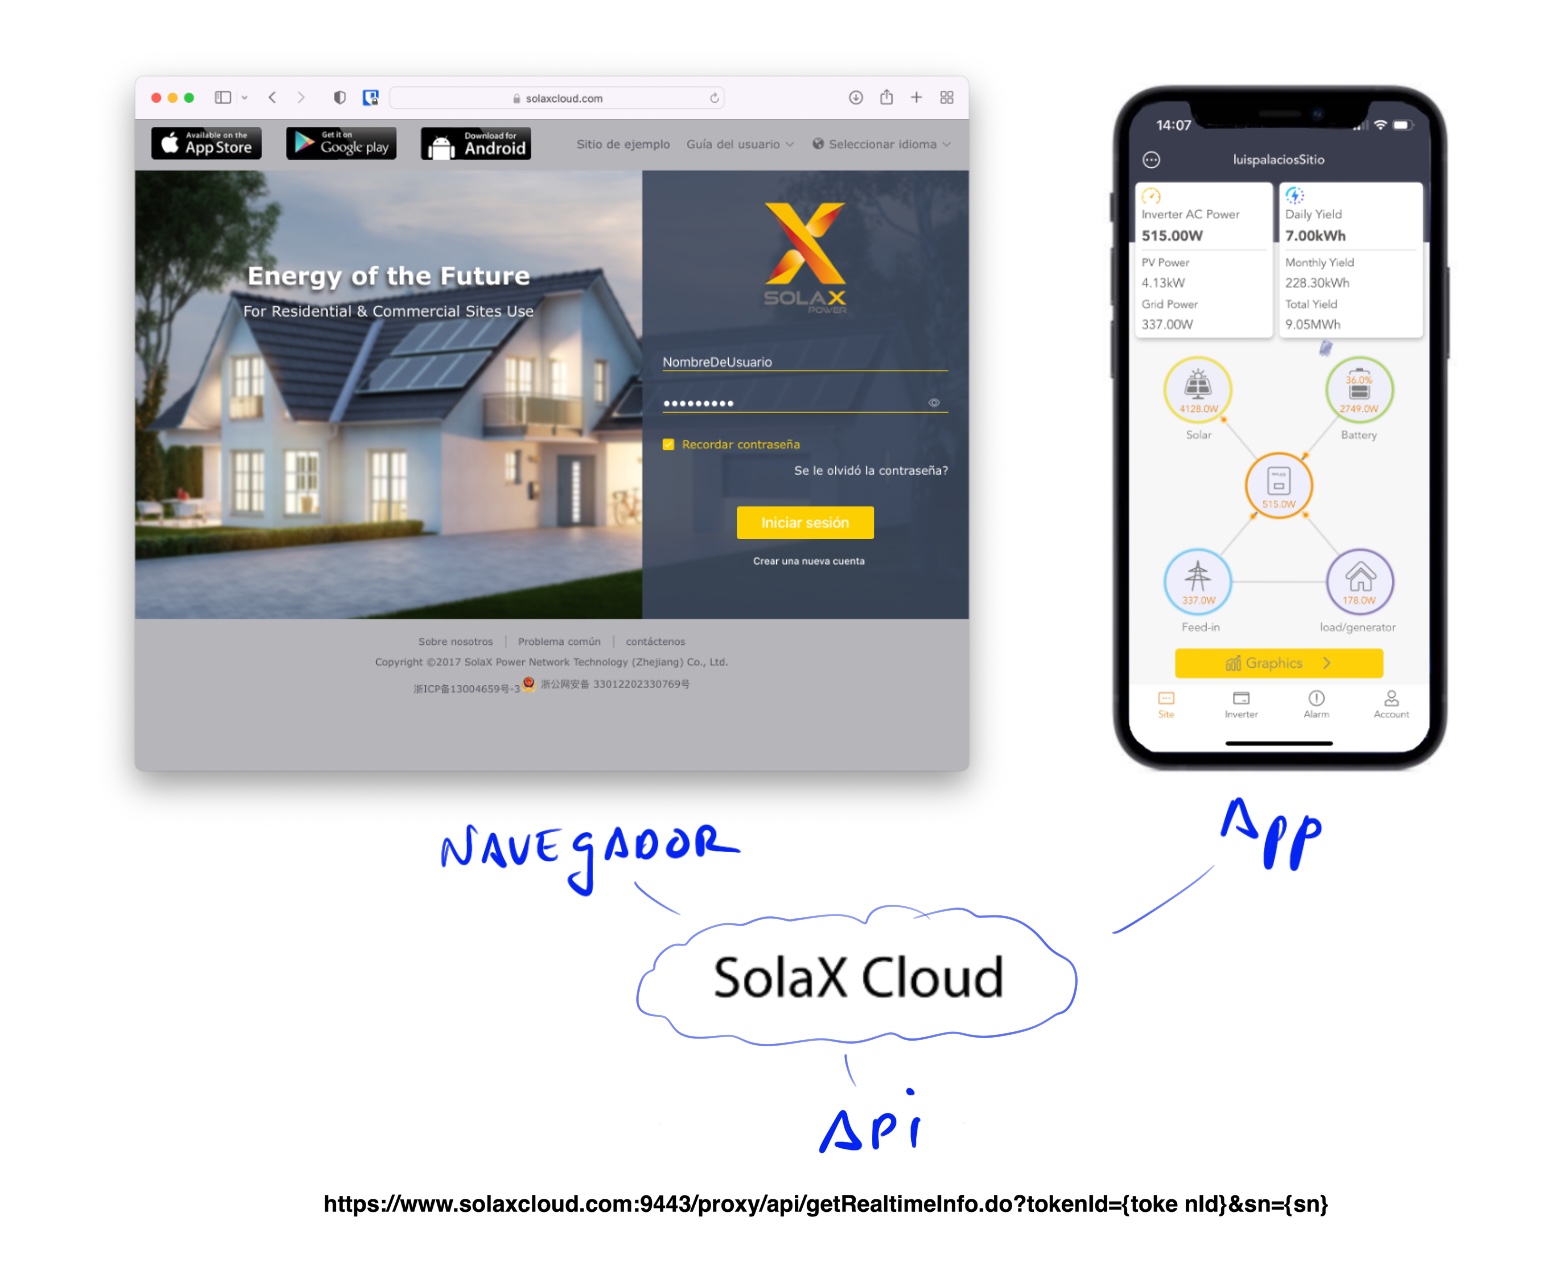
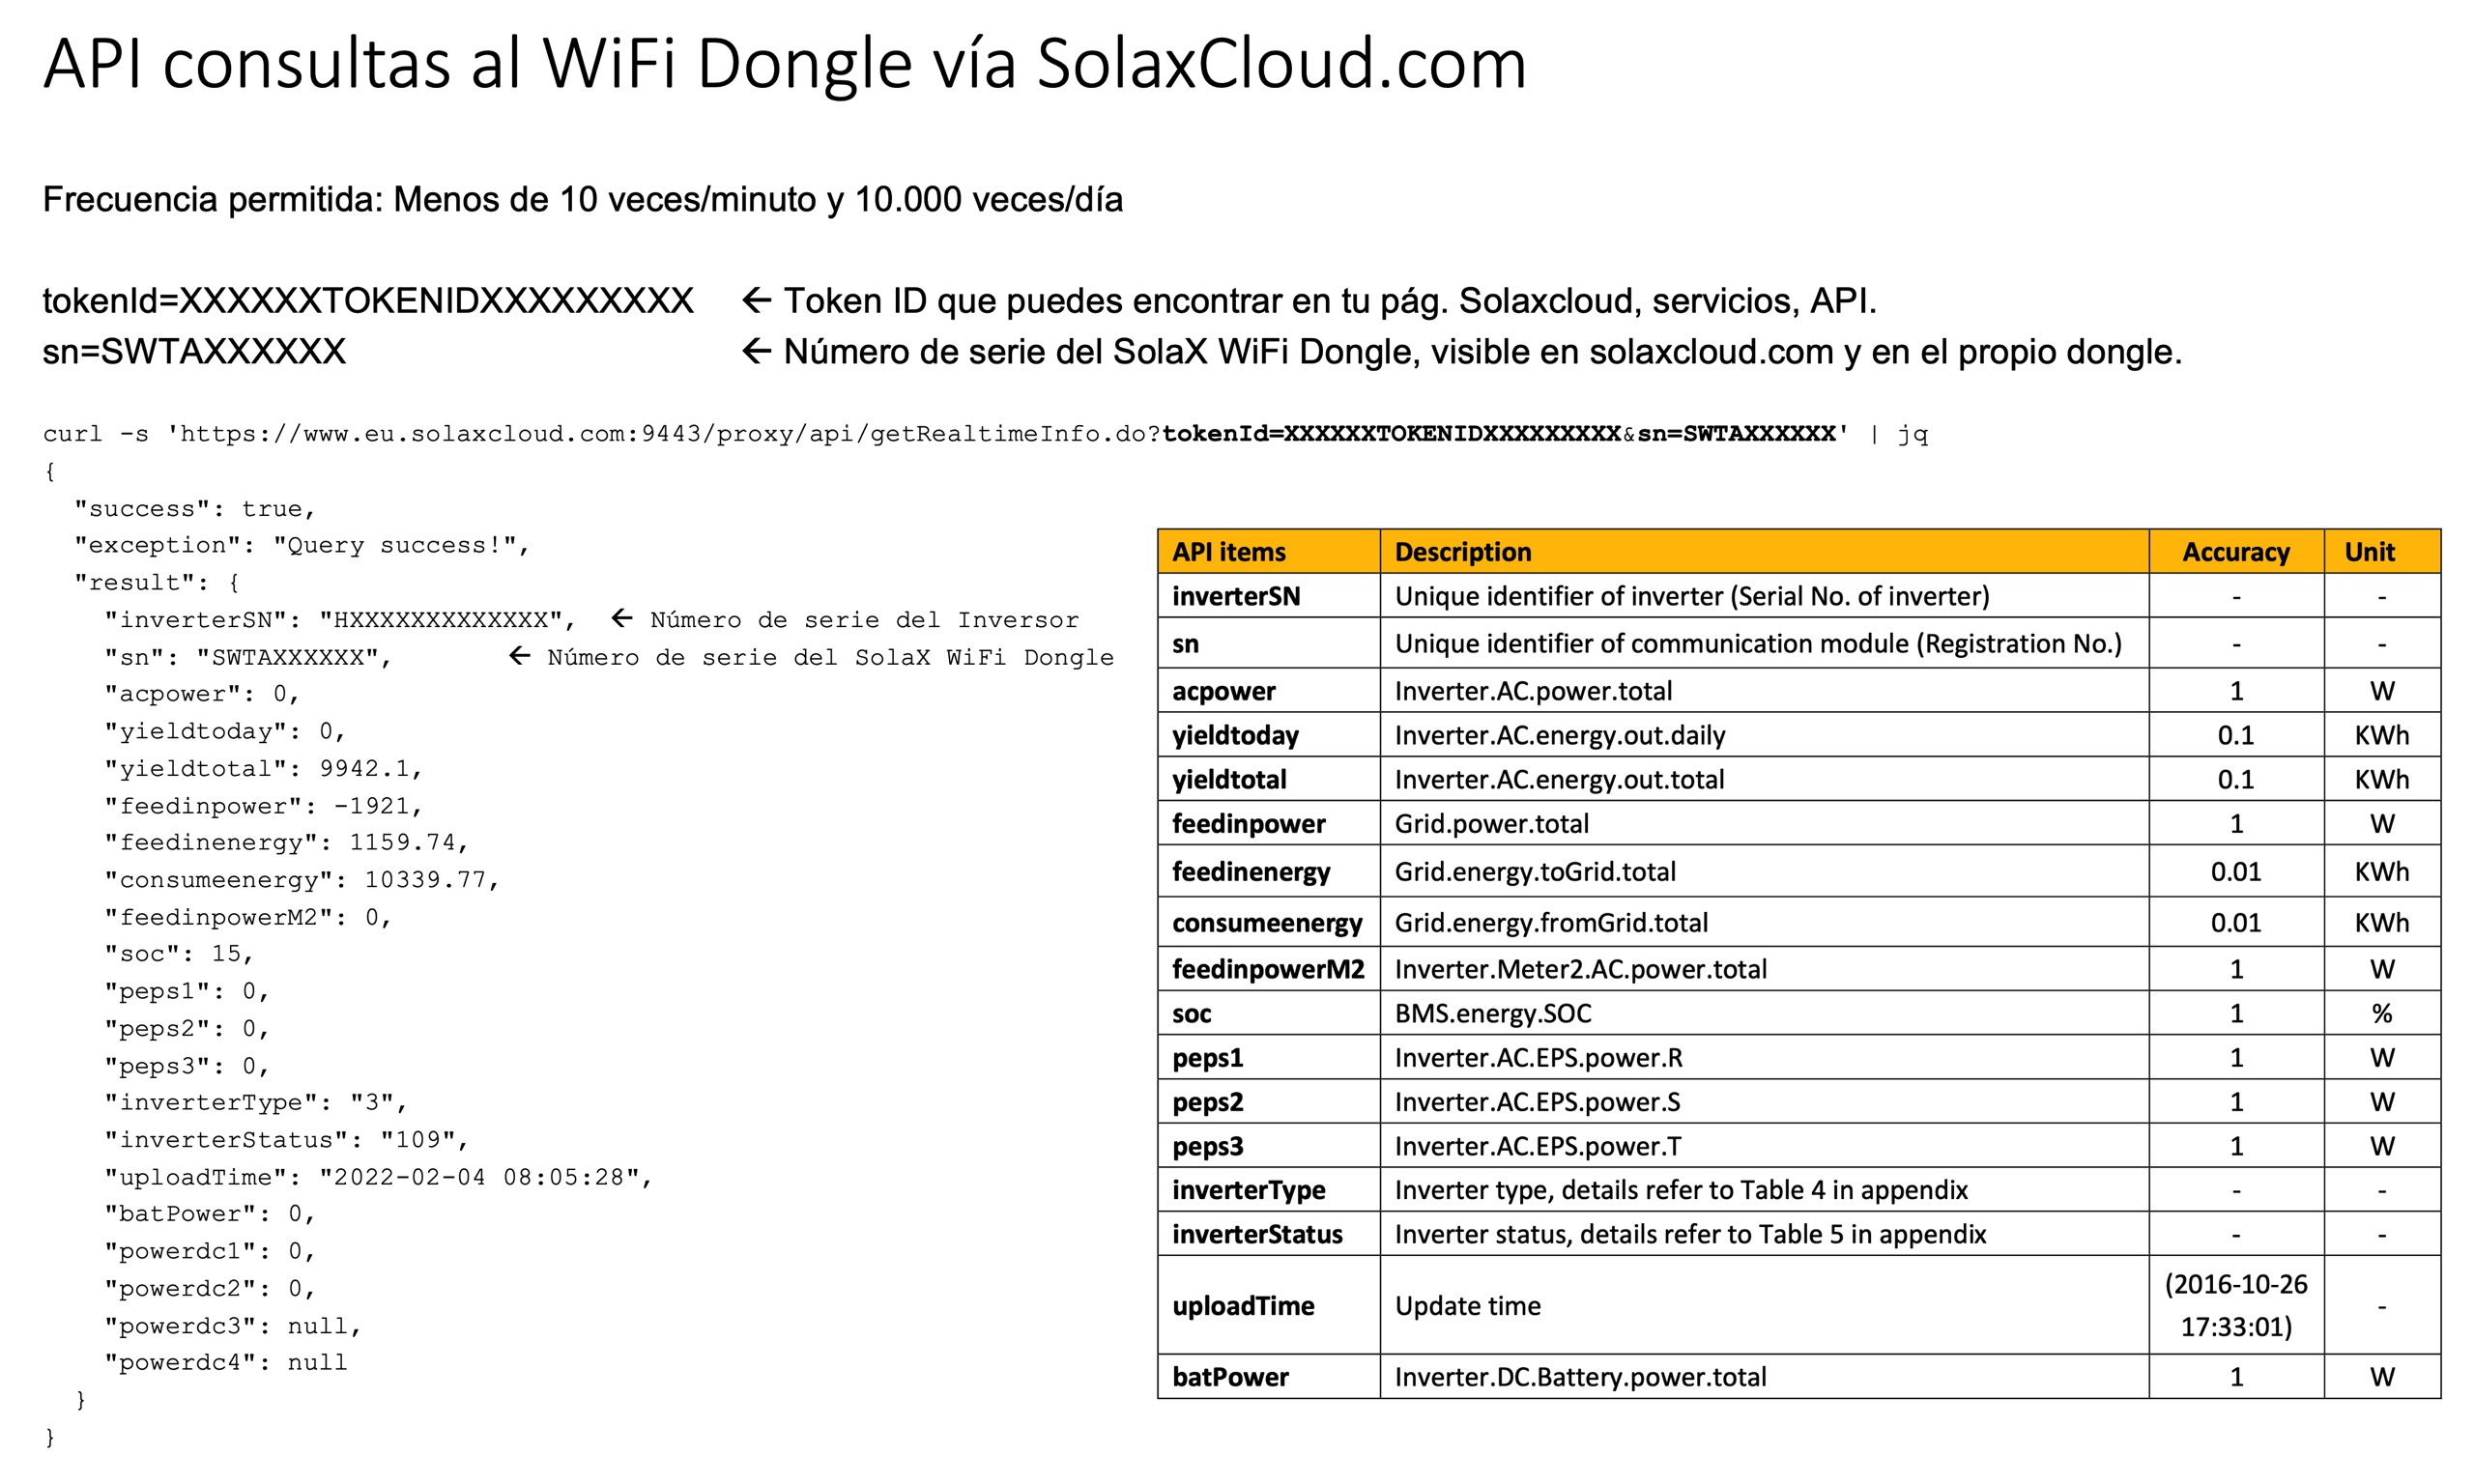
- You can query SolaX Cloud through REST/API and download the data locally.
Home Assistant Integration
I have never integrated via the SolaxCloud REST/API; in fact I don’t recommend it — the MODBUS option described below is much better. However, here are a couple of links:
- GitHub project for the SolaxCloud integration for Home Assistant.
- A good discussion thread here, where you’ll find many comments about this and other options…
2. Monitoring via Local Network (WiFi/LAN Dongle)
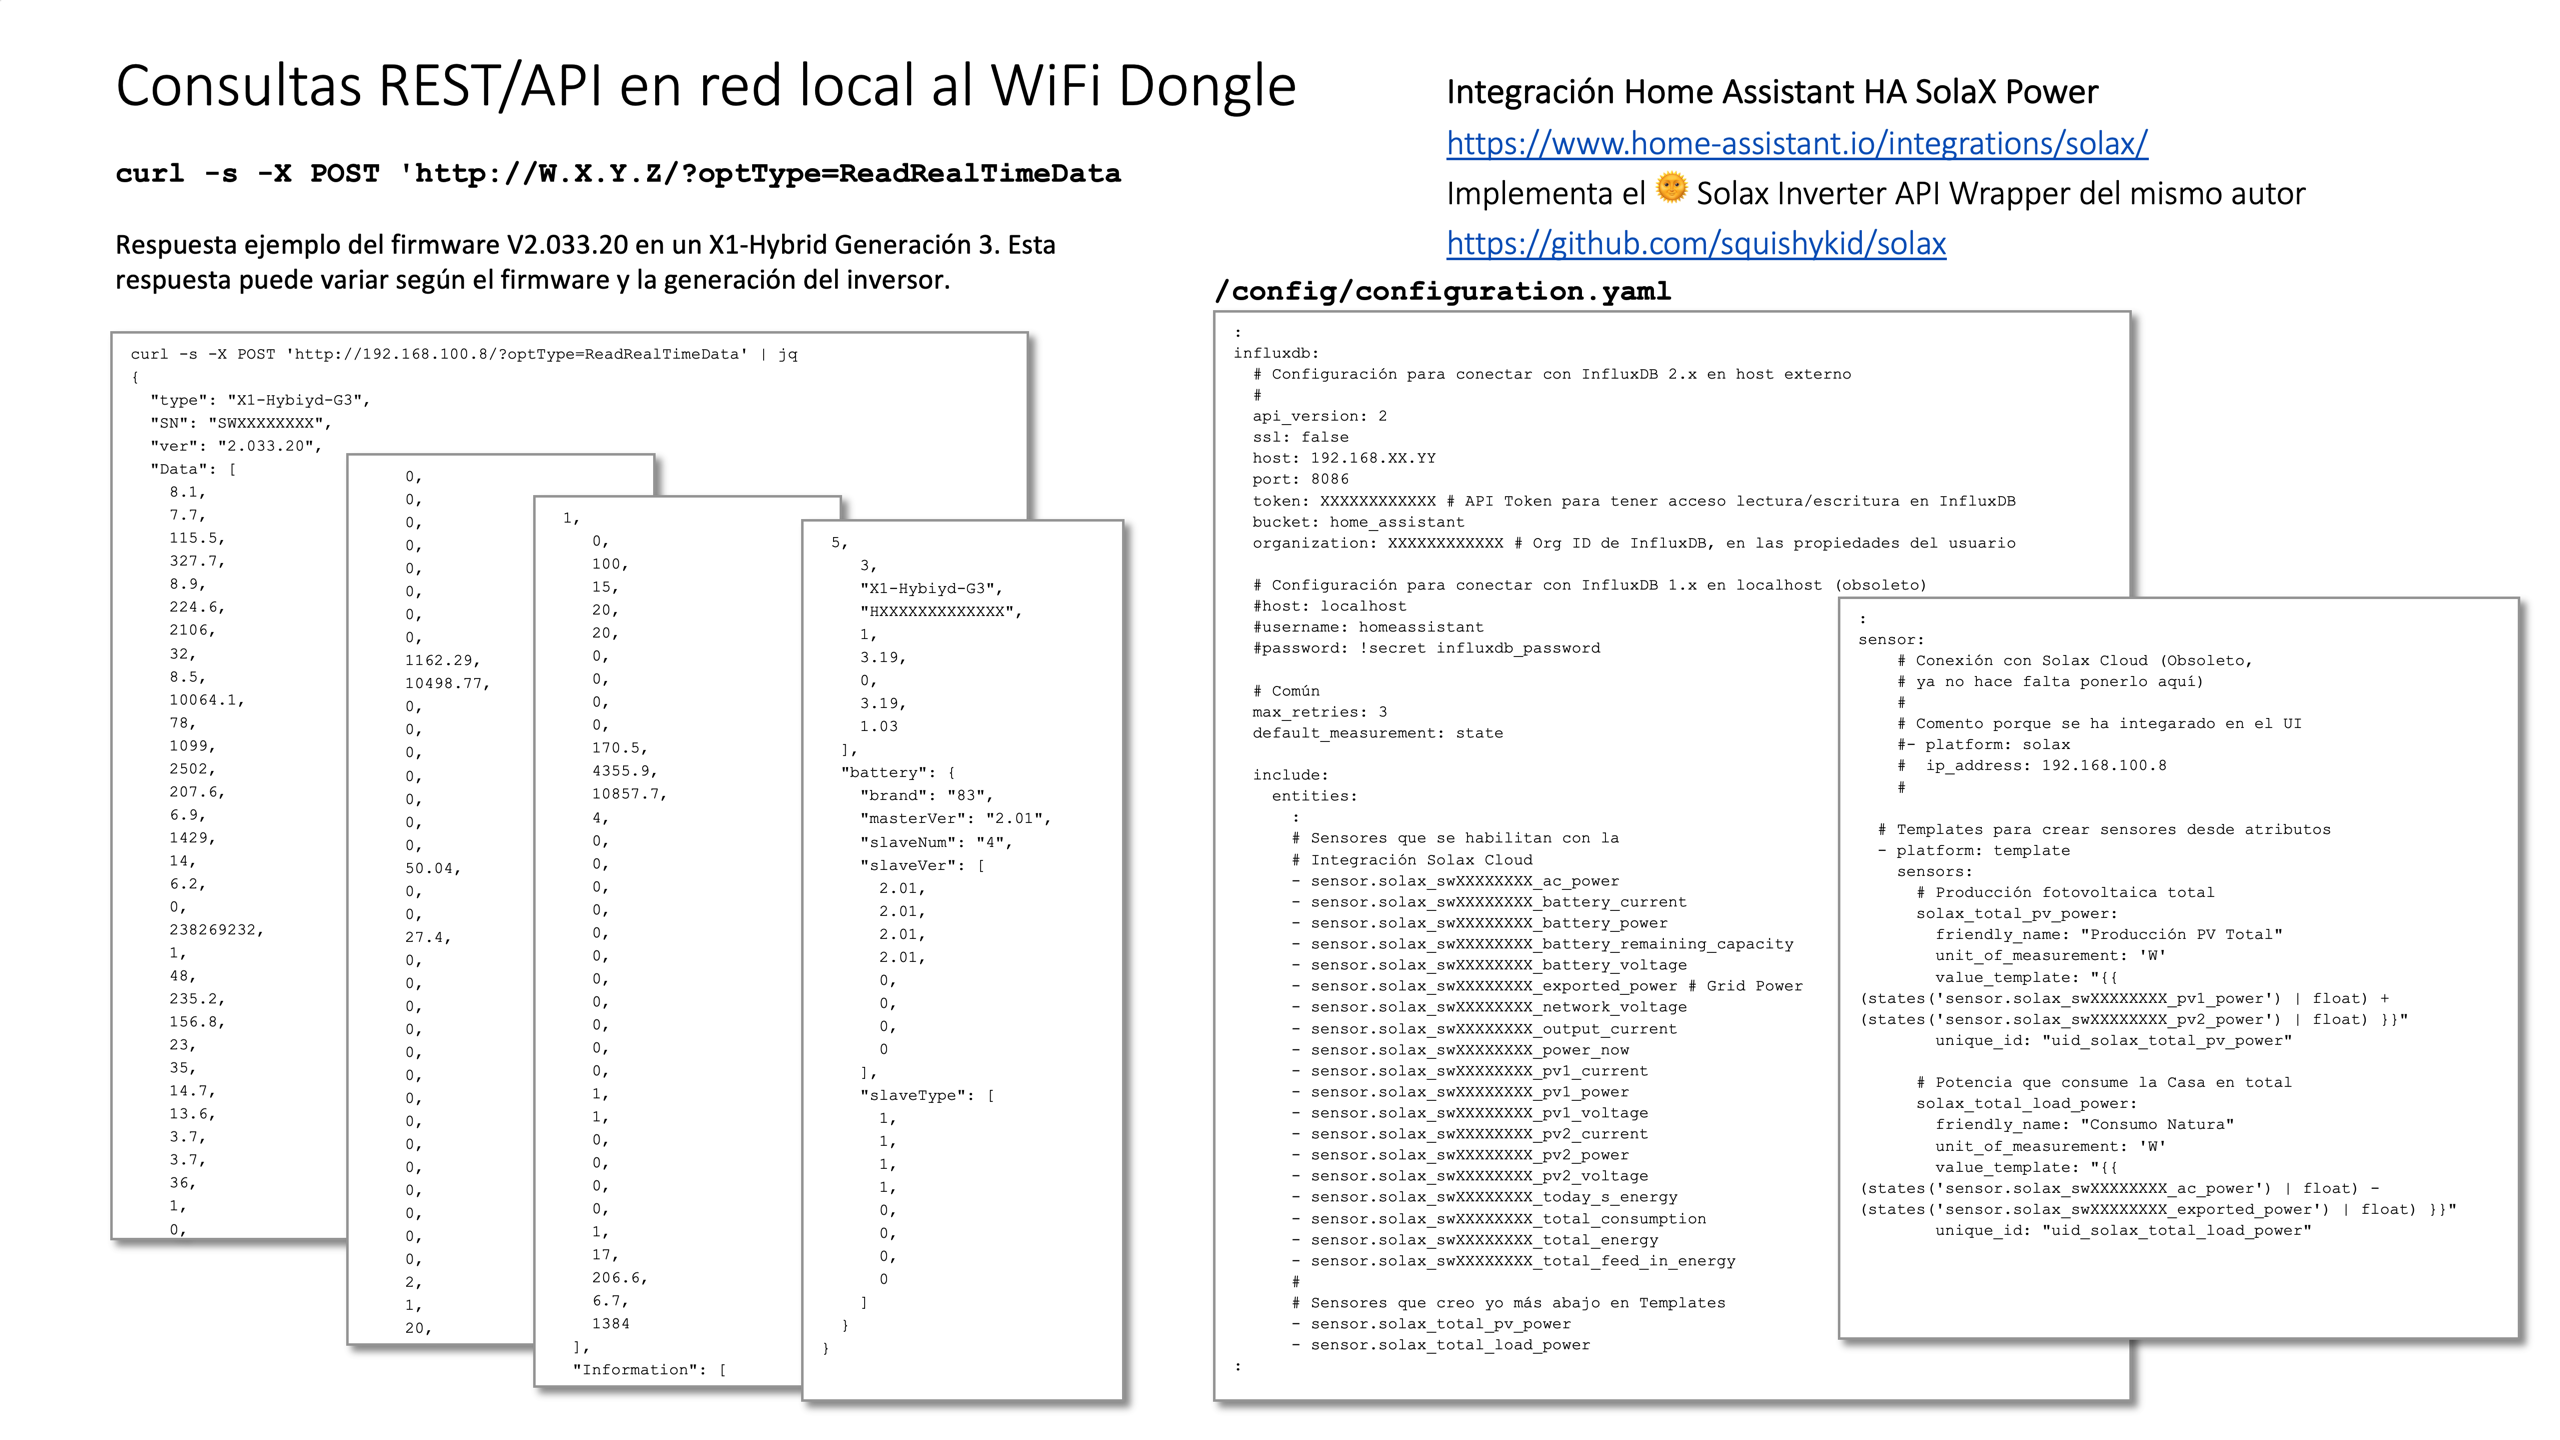
In my case I have the WiFi Dongle (I actually tried to buy the LAN one without success). Monitoring is achieved through direct REST API queries to the dongle.
Home Assistant Integration
The Home Assistant integration is available at: // SolaX Power, which implements the 🌞 Solax Inverter API Wrapper by the same author.
My observations and some challenges:
- I used it for over a year and it works relatively well, without too many issues. It exposes the most common metrics, though not all of them.
- The WiFi Dongle connects as a client to your WiFi network to reach SolaxCloud, but it also exposes a new WiFi network.
- My first surprise was this new SSID (WiFi_SWXXXXXXXX) without a password, using a fixed IP (5.8.8.8), and discovering that it only listens for REST API requests on this IP.
- In most cases, this means you need to set up a proxy at home. For example, a Raspberry Pi connected to your LAN and to this WiFi, running
nginxas a proxy. - Fortunately, I found this project with modified firmware for the Solax Pocket WiFi V2, which basically enables listening on the IP assigned by your home network.
- In most cases, this means you need to set up a proxy at home. For example, a Raspberry Pi connected to your LAN and to this WiFi, running
- Another challenge is stability — “sometimes” it would stop updating, for no apparent reason.
- The solution was unplugging/plugging the dongle (USB).
- The third challenge is that the Solax Power integration only works with firmware version V2.033.20, so I couldn’t update to the latest version V2.034.06.
3. Monitoring via Local Network (MODBUS/TCP)
Querying the inverter via the MODBUS/TCP protocol is the best option. Fortunately, my X1-HYBRID-G3 inverter supports receiving queries on port 502 (the default port for the MODBUS/TCP protocol). You need to connect an Ethernet cable from the LAN port on your inverter to your home local network. In my case, I assign a fixed IP address from my DHCP server using its MAC address.
Home Assistant Integration
There’s a very good Integration that reads far more data and at a higher frequency than the other options I’ve tried: homsassistant-solax-modbus. The author:
- Published his work in this thread, which is worth reading through.
- Has another very interesting repository, Home Assistant Configuration.
| Note: In my case I started with an old version (manual installation). Before installing the latest one, I removed the /config/custom_components/solax_modbus directory and deleted the integration from Configuration > Integrations. After the obligatory reboot, I was able to continue with the next step. |
Installation with HACS (0.4.5)
Since version 0.4.5, installation is possible from HACS, the Home Assistant Community Store.
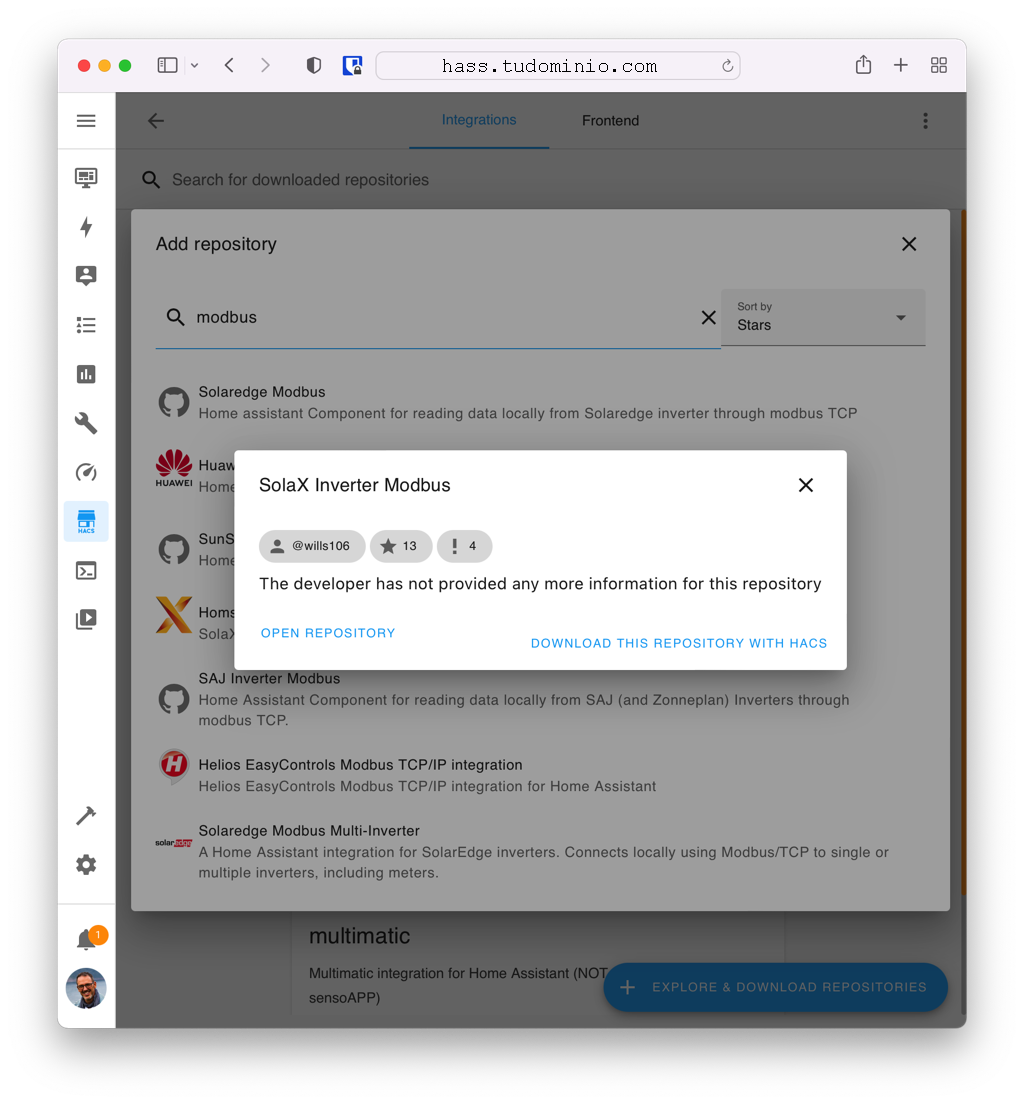
- HACS > Integrations > Explore & Download Repositories > search for “modbus”
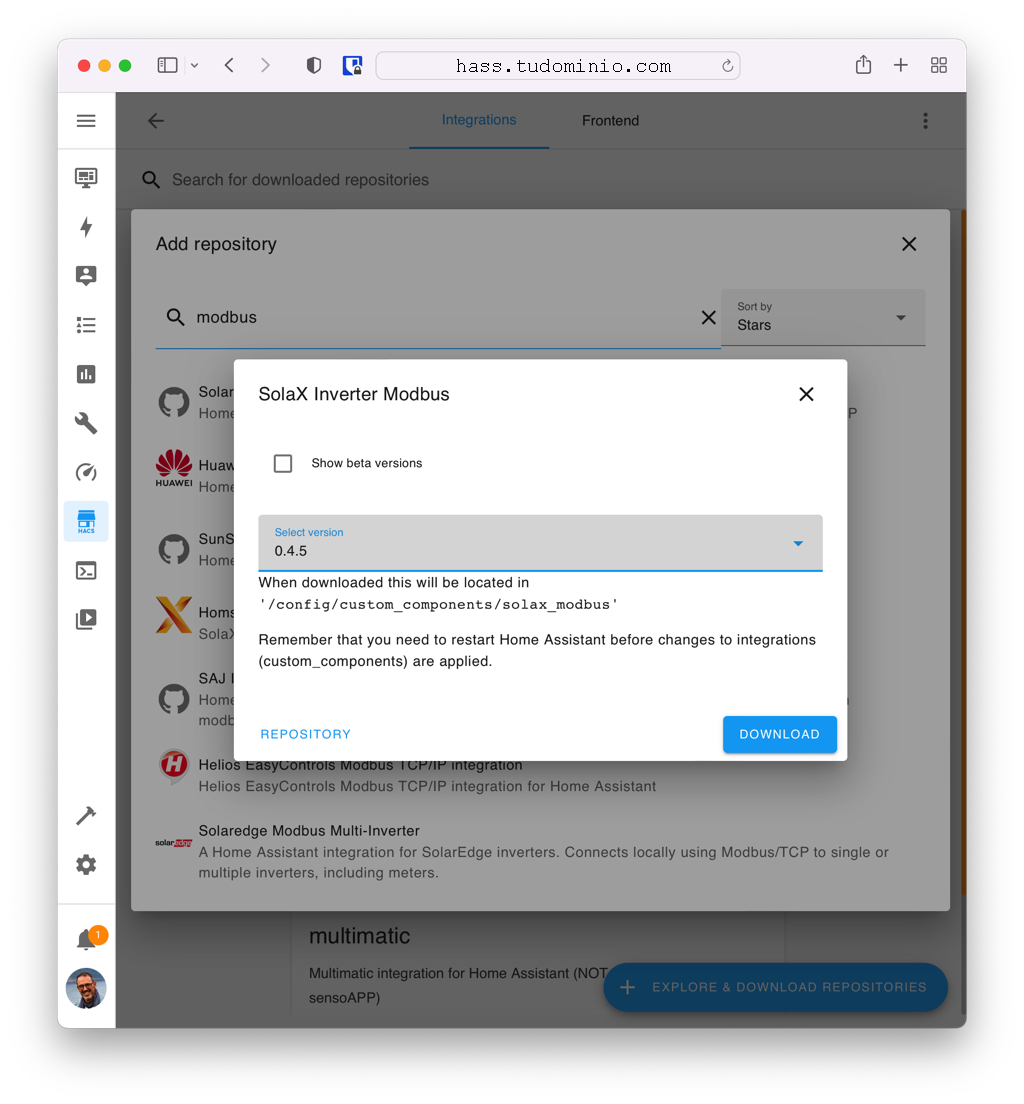
I select the latest version
I restart Home Assistant from Configuration > Settings > Restart
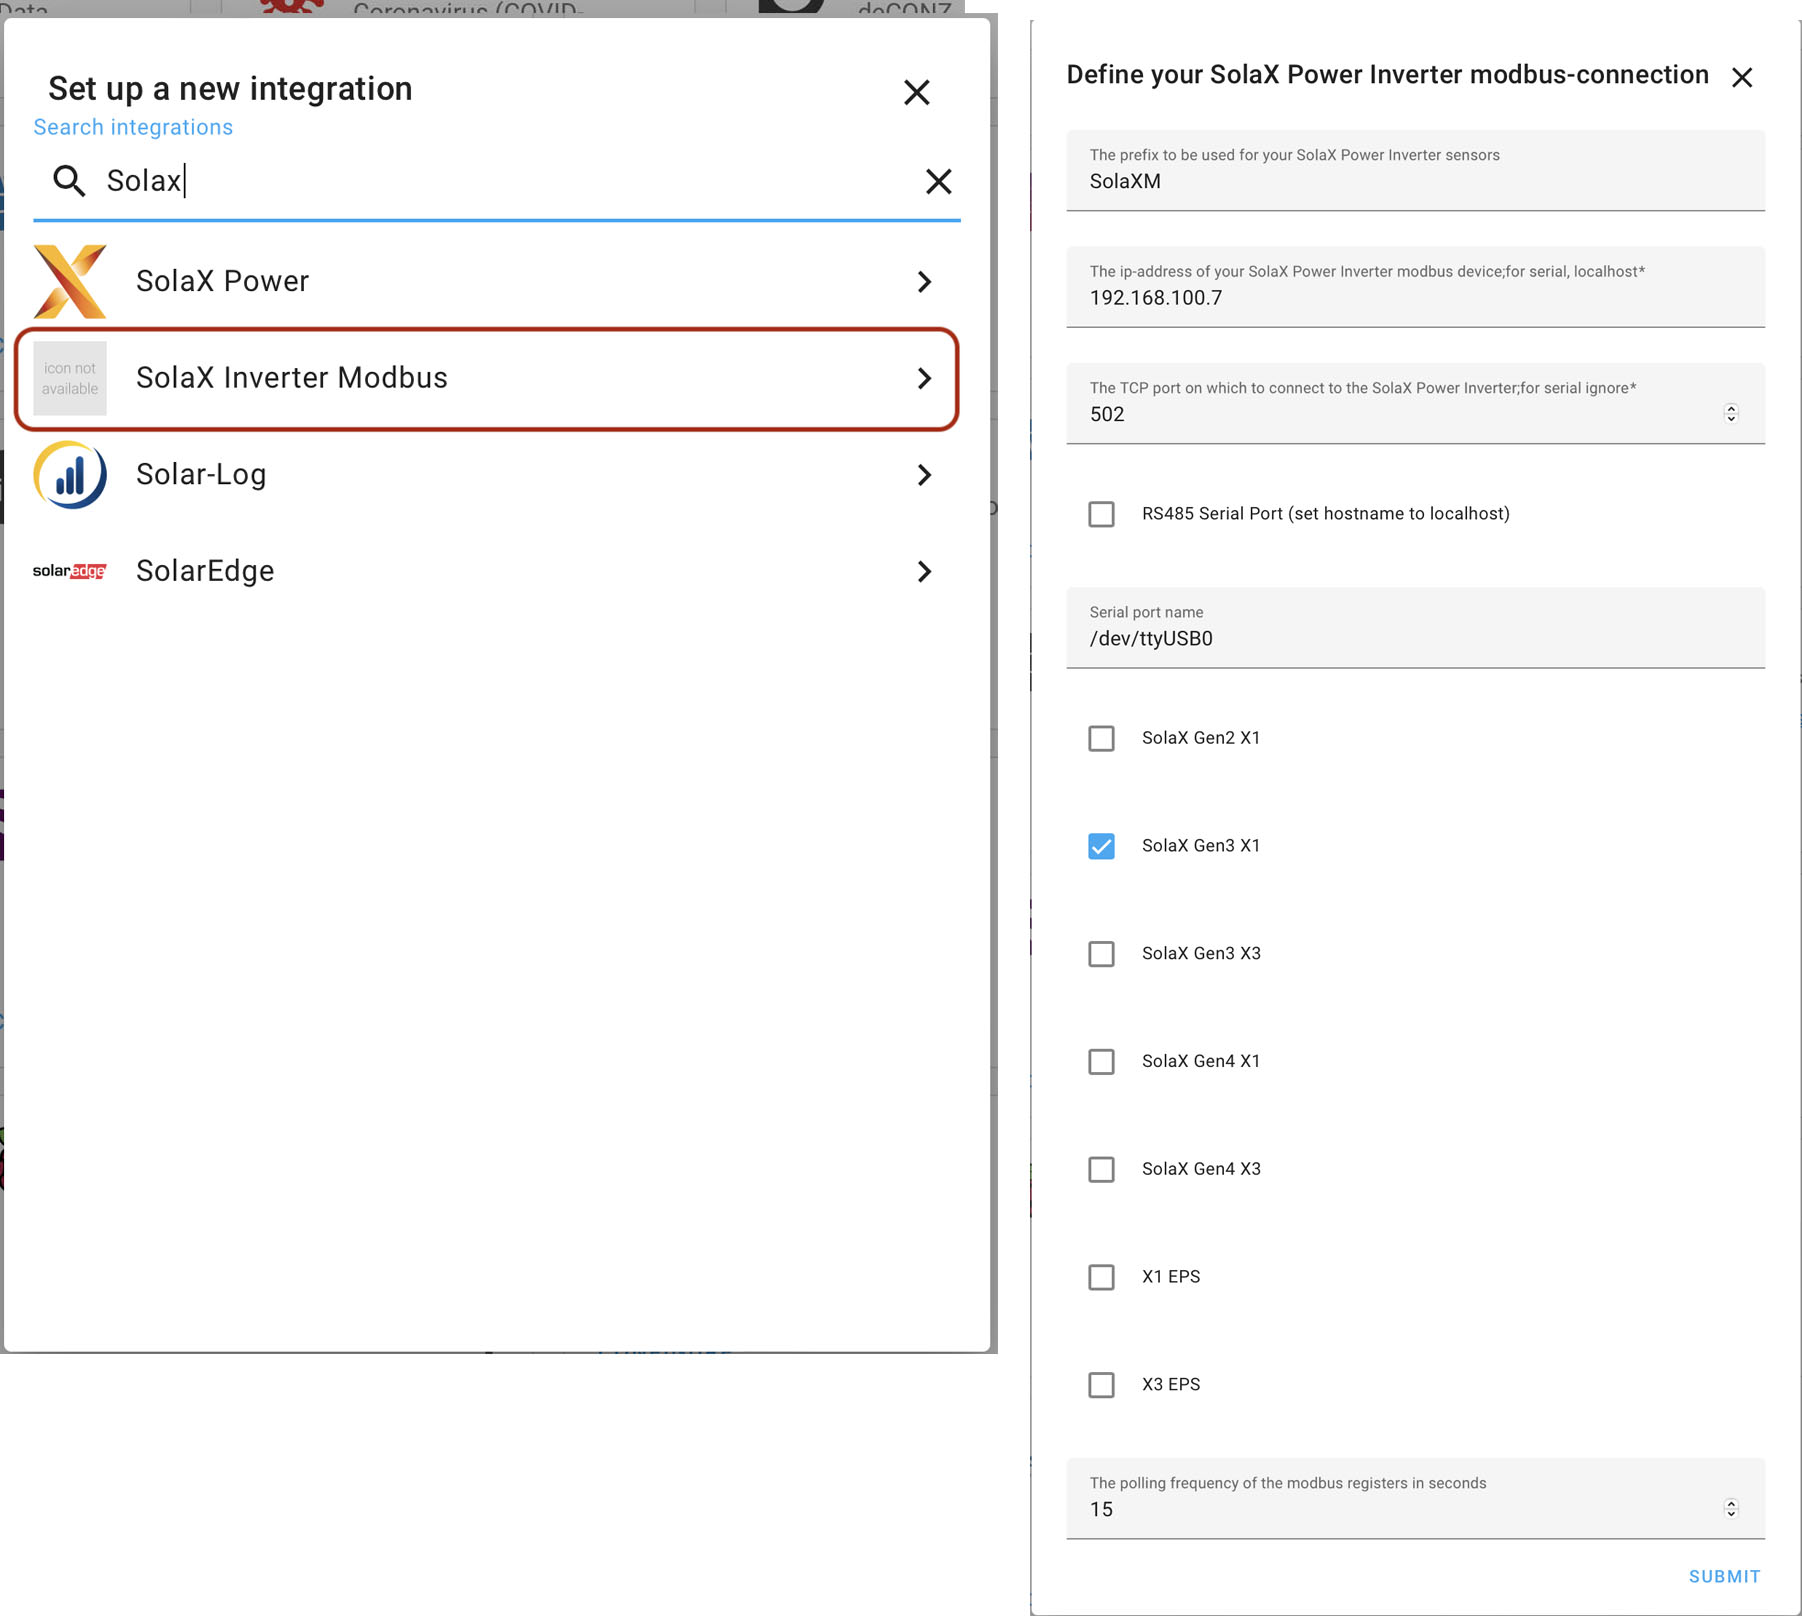
I go to Configuration > Device & Services > Add Integration > Setup a new Integration, search for solax and select SolaX Inverter Modbus. I name it SolaXM (the M stands for Modbus), enter its IP, select MY MODEL and set the polling frequency to 15s, more than enough…
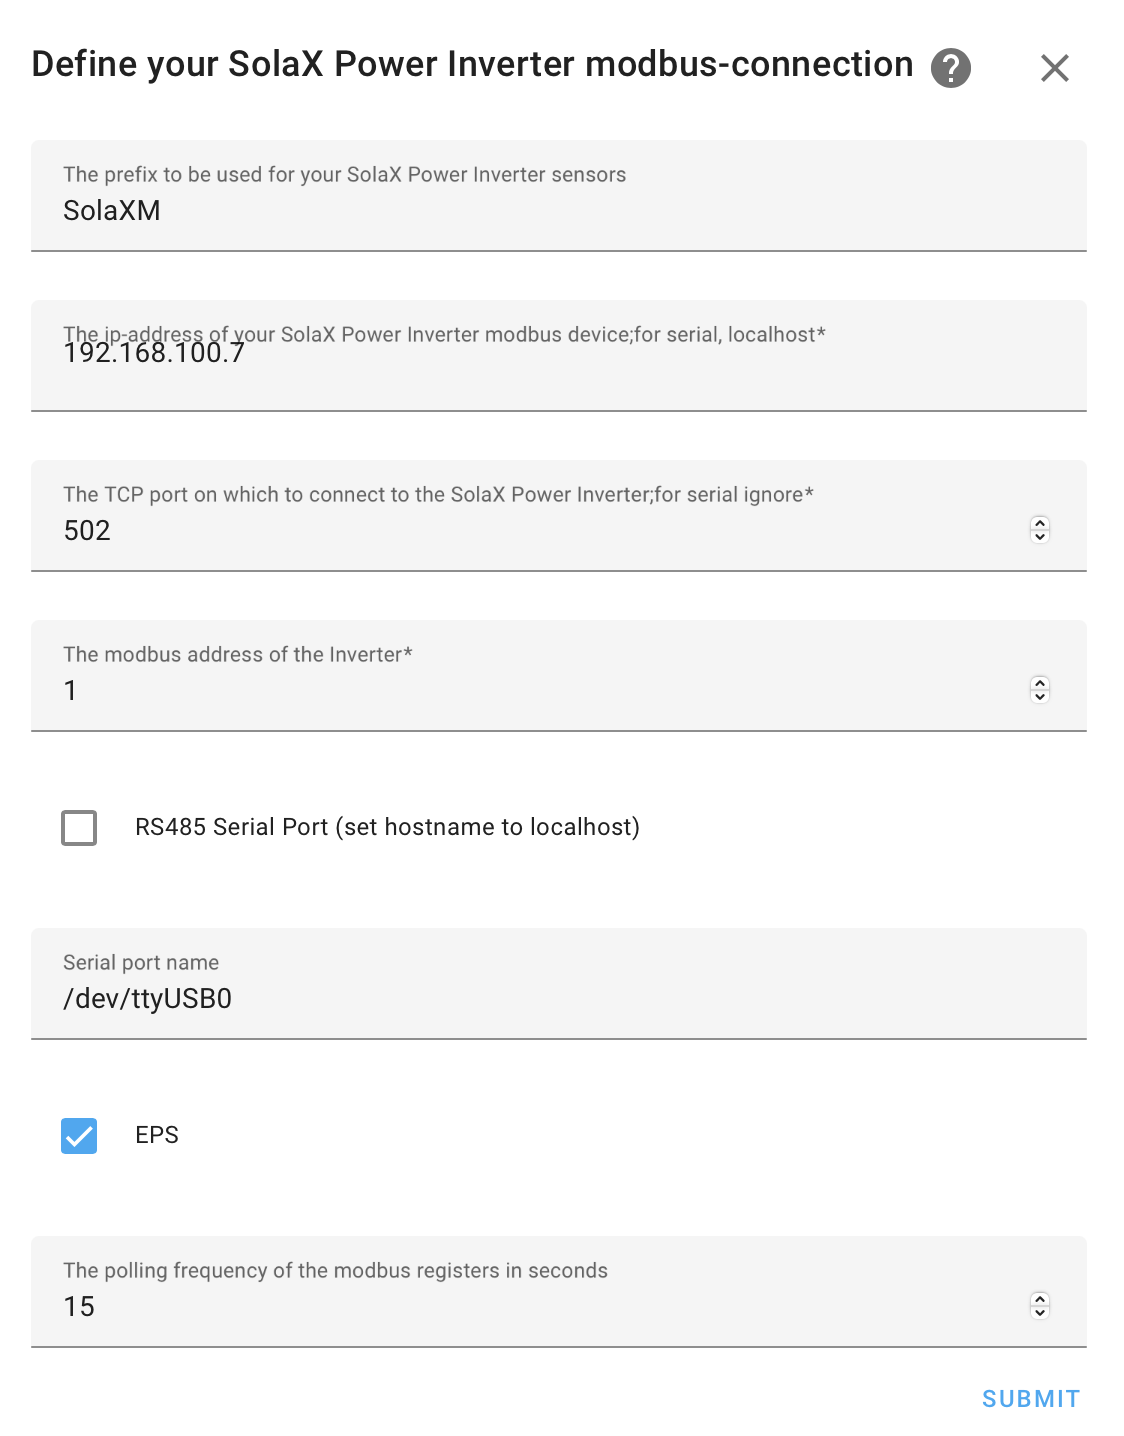
It now appears in Configuration > Devices & Services > Integrations. I enter the device and add it to the Lovelace UI.
Migration from 0.4.x to 0.5.3a
When version 0.5.x was released, the author recommended (discussion #26) removing the integration (0.4.x) and recreating it with the new one (0.5.x) keeping the same device name, so that the rest of your configuration is preserved when installing the new version.
I confirm my device name, in my case I had named it
SolaXM- Configuration > Devices & Services > SolaXM (SolaX Inverter Modbus) > “…” > Rename
I delete the Solax modbus device
- Configuration > Devices & Services > SolaXM (SolaX Inverter Modbus) > “…” > Delete
I restart HA
- Configuration > Settings > Server Control > Home Assistant > Restart
I remove the Solax modbus integration in HACS
- HACS > Integrations > SolaX Inverter Modbus > “…” > Remove
I reinstall the new version 0.5.3a
- HACS > Integrations > Explore & Download Repositories > search for “modbus”
- SolaX Inverter Modbus > Download this repository > Select the latest (0.5.3a) > Download
I restart Home Assistant
- Configuration > Settings > Server Control > Home Assistant > Restart
I add the device again
- Configuration > Device & Services > Add Integration > Setup a new Integration
- Search for
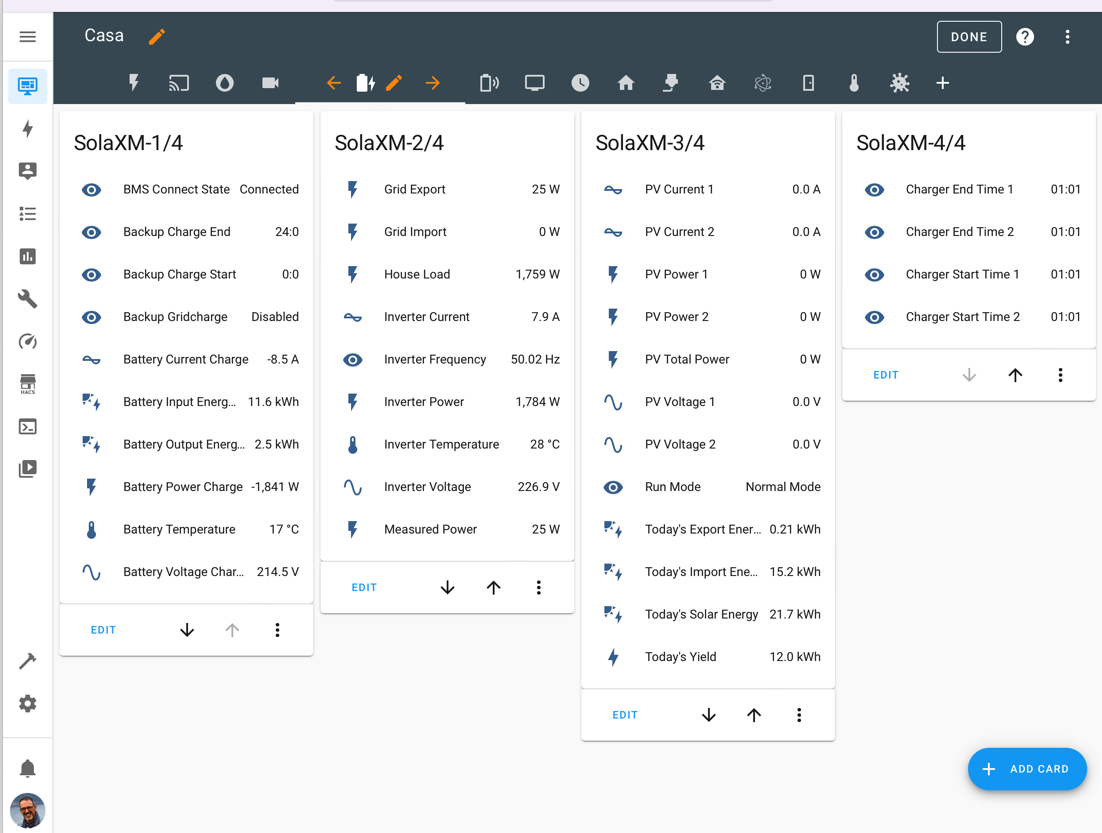
solax> SolaX Inverter Modbus > name itSolaXM - Enter its IP and other parameters.
| Note: This time I didn’t need to specify my inverter model — it was detected by the beginning of its serial number. I shared this with the author (discussion #26). |
Exporting Data to InfluxDB
To export data I’m going to use my external server with InfluxDB 2.x and Grafana (a post about that). By the way, I migrated from InfluxDB 1.x (embedded in HASS) to this external version (migration steps here).
I configure /config/configuration.yaml to send my inverter data to the InfluxDB server. If your inverter is different, you’ll have similar but not identical data.
:
influxdb:
  # New InfluxDB 2.x
  api_version: 2
  ssl: false
  host: 192.168.X.Y
  port: 8086
  token: MY-USER-TOKEN (influxdb>LoadData>API Token)
  bucket: home_assistant
  organization: MY-ORGANIZATION-ID (influxdb>User Icon>About)
  max_retries: 3
  default_measurement: state
  include:
    entities:
     :
      # Add sensor.solaxm entries here
      - sensor.solaxm_bms_connect_state
      - sensor.solaxm_backup_charge_end
      - sensor.solaxm_backup_charge_start
      - sensor.solaxm_backup_gridcharge
      - sensor.solaxm_battery_capacity
      - sensor.solaxm_battery_current_charge
      - sensor.solaxm_battery_input_energy_today
      - sensor.solaxm_battery_output_energy_today
      - sensor.solaxm_battery_power_charge
      - sensor.solaxm_battery_temperature
      - sensor.solaxm_battery_voltage_charge
      - sensor.solaxm_charger_end_time_1
      - sensor.solaxm_charger_end_time_2
      - sensor.solaxm_charger_start_time_1
      - sensor.solaxm_charger_start_time_2
      - sensor.solaxm_grid_export
      - sensor.solaxm_grid_import
      - sensor.solaxm_house_load
      - sensor.solaxm_inverter_current
      - sensor.solaxm_inverter_frequency
      - sensor.solaxm_inverter_power
      - sensor.solaxm_inverter_temperature
      - sensor.solaxm_inverter_voltage
      - sensor.solaxm_measured_power
      - sensor.solaxm_pv_current_1
      - sensor.solaxm_pv_current_2
      - sensor.solaxm_pv_power_1
      - sensor.solaxm_pv_power_2
      - sensor.solaxm_pv_total_power
      - sensor.solaxm_pv_voltage_1
      - sensor.solaxm_pv_voltage_2
      - sensor.solaxm_run_mode
      - sensor.solaxm_today_s_export_energy
      - sensor.solaxm_today_s_import_energy
      - sensor.solaxm_today_s_solar_energy
      - sensor.solaxm_today_s_yield
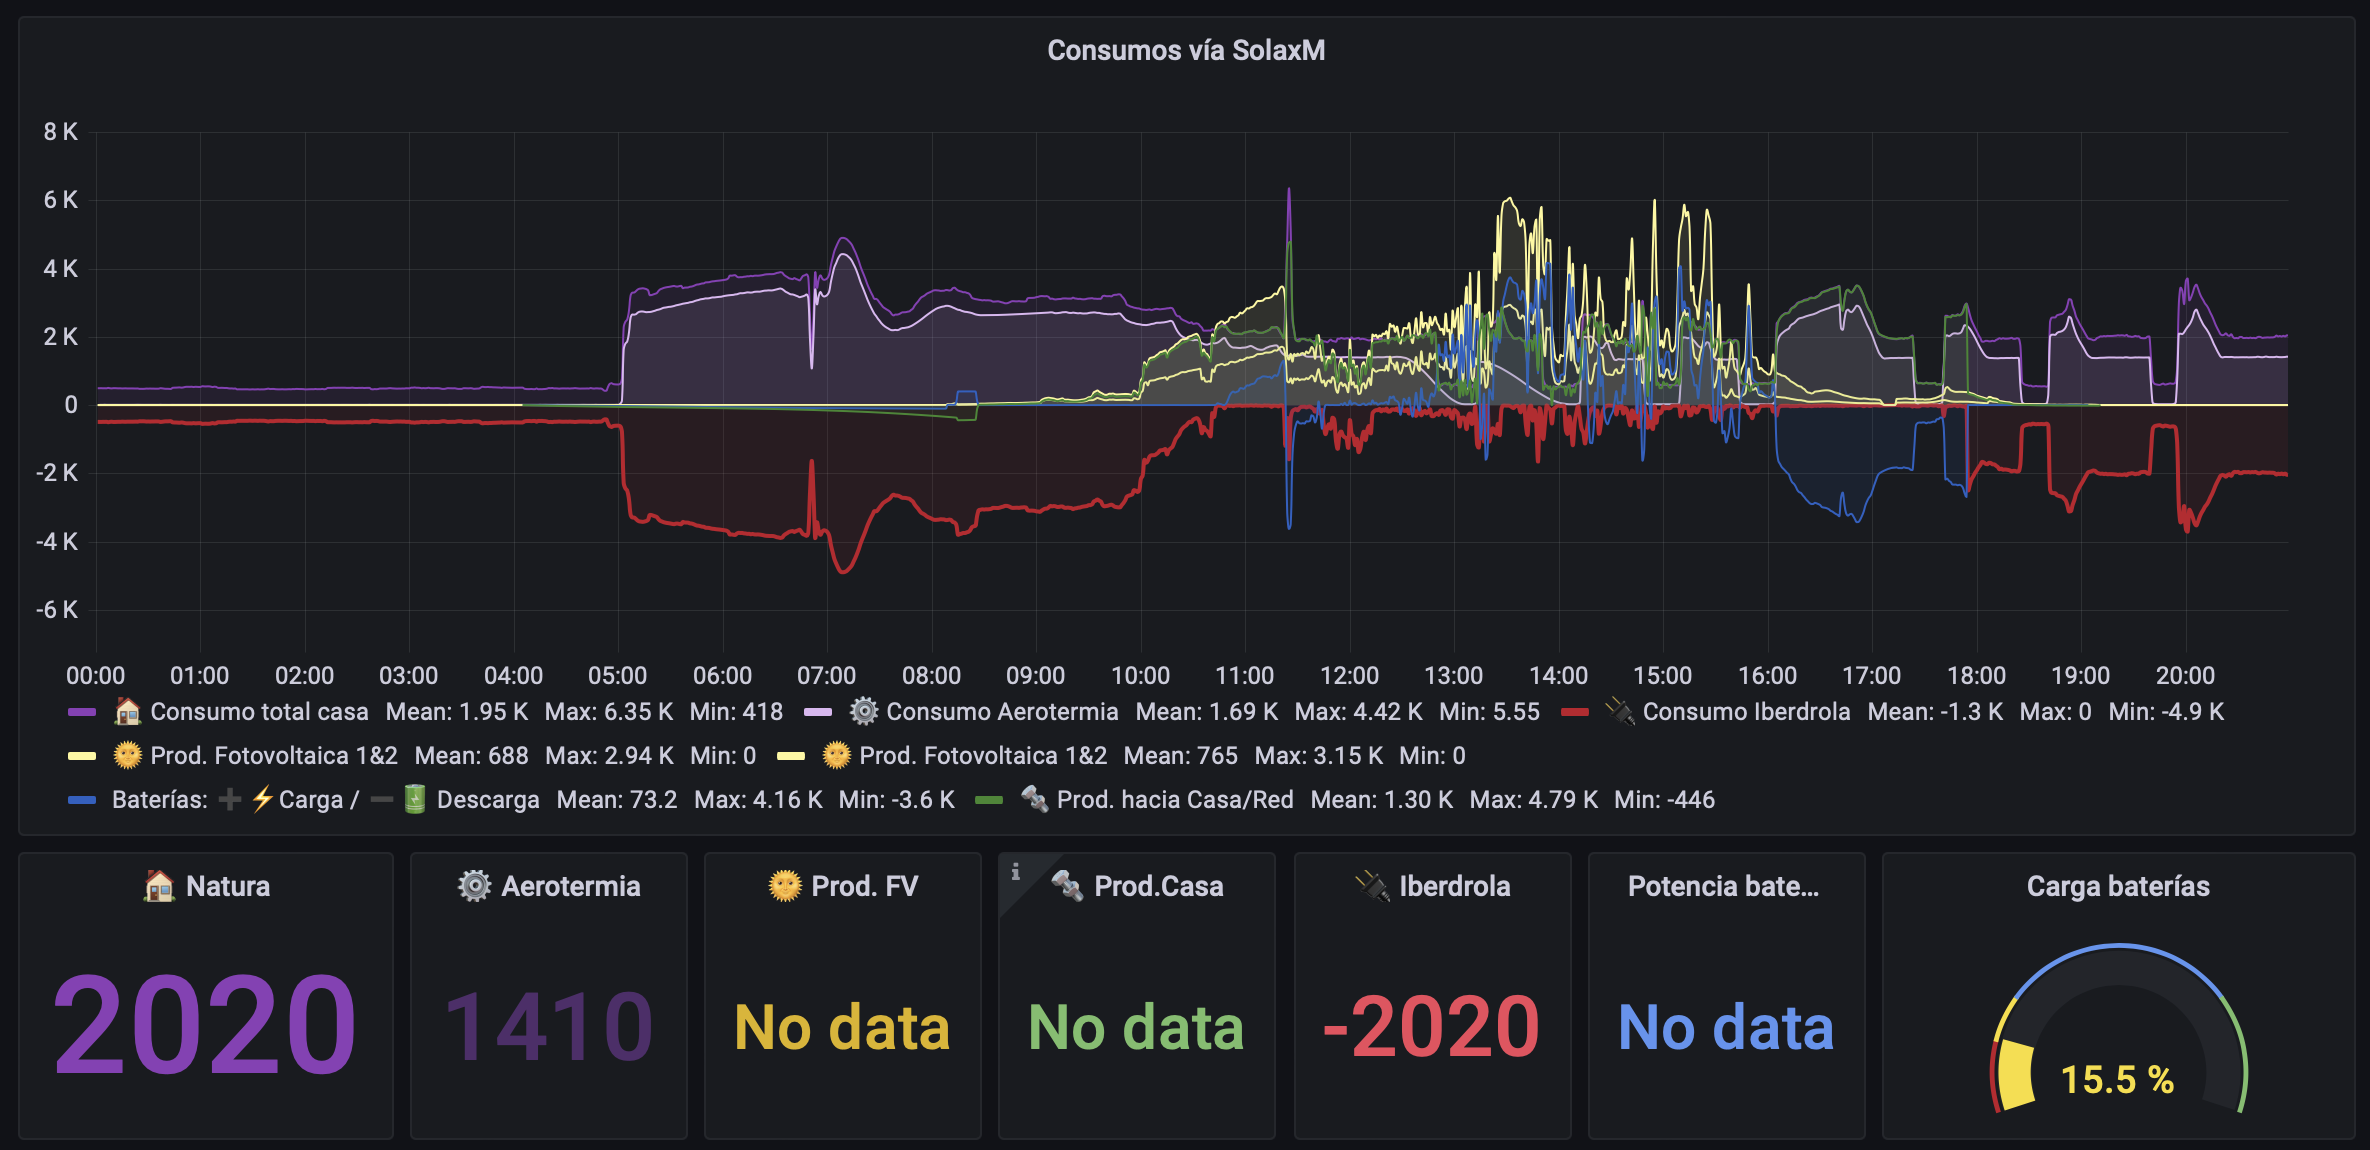
Grafana Configuration for Consumption Visualization
The next step is to configure a Dashboard in Grafana to display some of that data.
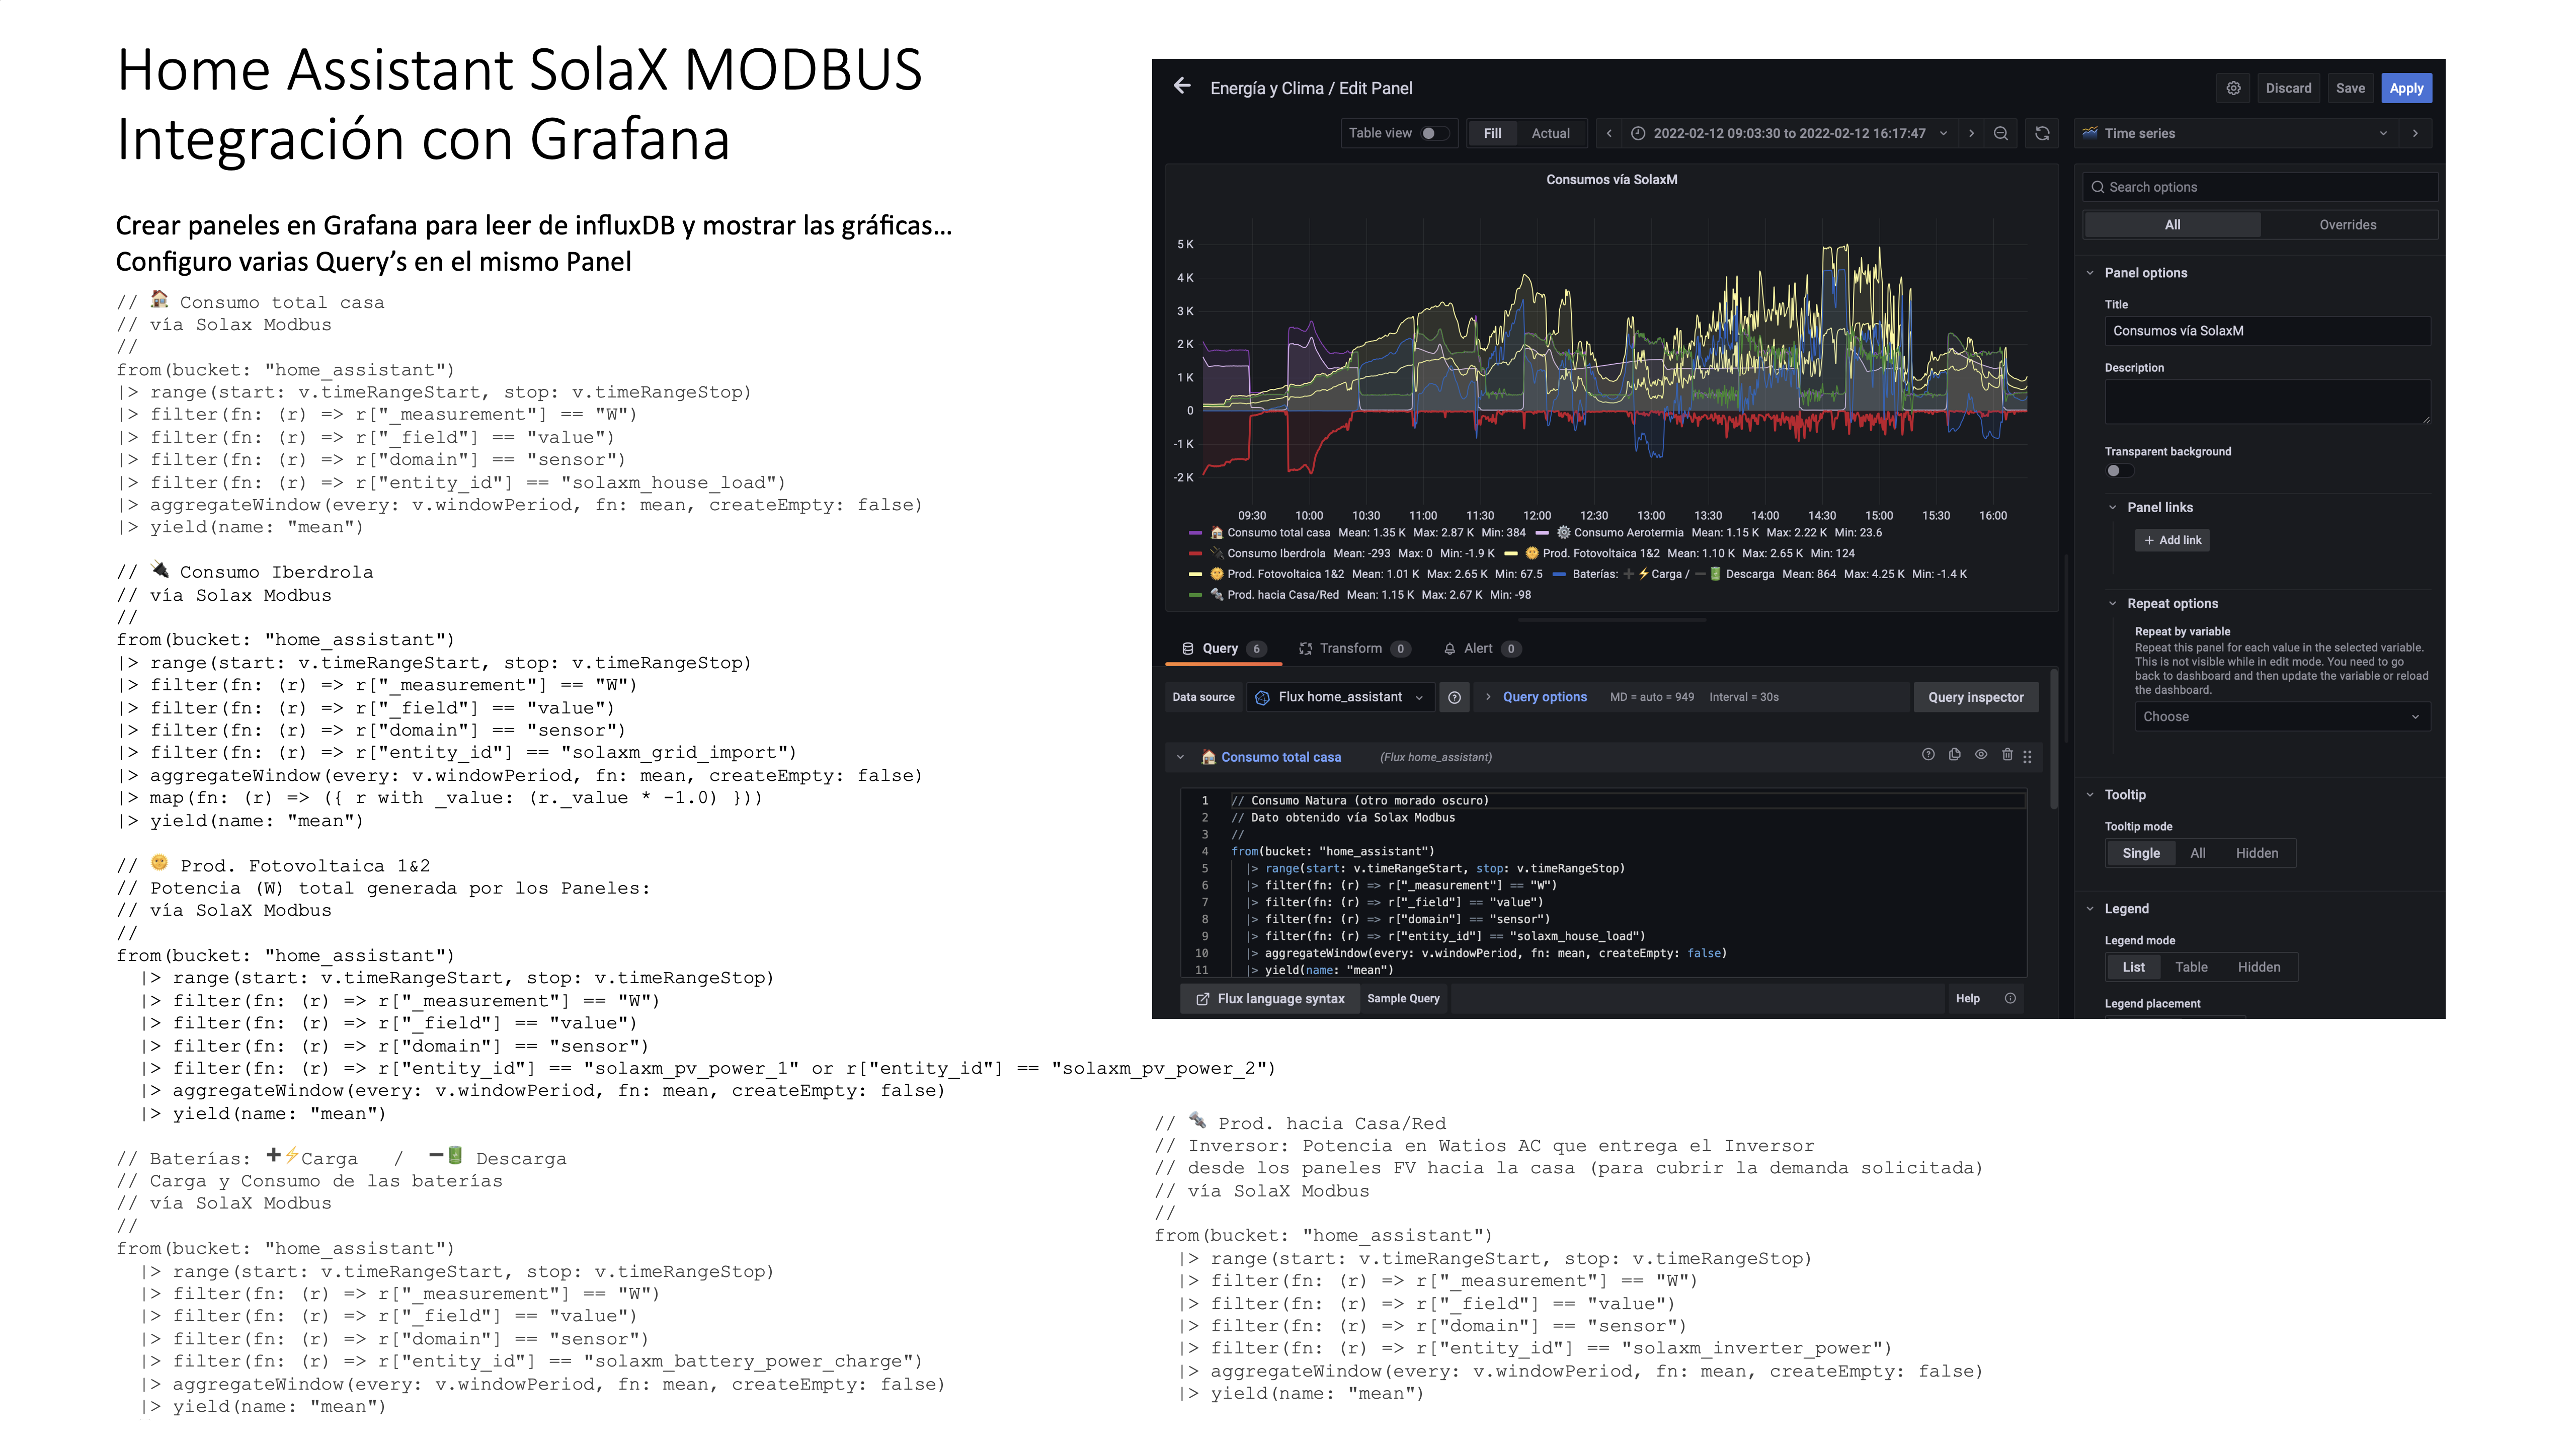
Here are the queries using the new Flux Script…
// 🏠 Total house consumption
// via Solax Modbus
//
from(bucket: "home_assistant")
|> range(start: v.timeRangeStart, stop: v.timeRangeStop)
|> filter(fn: (r) => r["_measurement"] == "W")
|> filter(fn: (r) => r["_field"] == "value")
|> filter(fn: (r) => r["domain"] == "sensor")
|> filter(fn: (r) => r["entity_id"] == "solaxm_house_load")
|> aggregateWindow(every: v.windowPeriod, fn: mean, createEmpty: false)
|> yield(name: "mean")

// 🔌 Grid consumption
// via Solax Modbus
//
from(bucket: "home_assistant")
|> range(start: v.timeRangeStart, stop: v.timeRangeStop)
|> filter(fn: (r) => r["_measurement"] == "W")
|> filter(fn: (r) => r["_field"] == "value")
|> filter(fn: (r) => r["domain"] == "sensor")
|> filter(fn: (r) => r["entity_id"] == "solaxm_grid_import")
|> aggregateWindow(every: v.windowPeriod, fn: mean, createEmpty: false)
|> map(fn: (r) => ({ r with _value: (r._value * -1.0) }))
|> yield(name: "mean")

// 🌞 Photovoltaic Production 1&2
// Total power (W) generated by the Panels:
// via SolaX Modbus
//
from(bucket: "home_assistant")
  |> range(start: v.timeRangeStart, stop: v.timeRangeStop)
  |> filter(fn: (r) => r["_measurement"] == "W")
  |> filter(fn: (r) => r["_field"] == "value")
  |> filter(fn: (r) => r["domain"] == "sensor")
  |> filter(fn: (r) => r["entity_id"] == "solaxm_pv_power_1" or r["entity_id"] == "solaxm_pv_power_2")
  |> aggregateWindow(every: v.windowPeriod, fn: mean, createEmpty: false)
  |> yield(name: "mean")

// Batteries: ➕⚡️Charge   /  ➖🔋 Discharge
// Battery charge and discharge
// via SolaX Modbus
//
from(bucket: "home_assistant")
  |> range(start: v.timeRangeStart, stop: v.timeRangeStop)
  |> filter(fn: (r) => r["_measurement"] == "W")
  |> filter(fn: (r) => r["_field"] == "value")
  |> filter(fn: (r) => r["domain"] == "sensor")
  |> filter(fn: (r) => r["entity_id"] == "solaxm_battery_power_charge")
  |> aggregateWindow(every: v.windowPeriod, fn: mean, createEmpty: false)
  |> yield(name: "mean")

// 🔩 Production to House/Grid
// Inverter: AC power in Watts delivered by the Inverter
// from the PV panels to the house (to meet the requested demand)
// via SolaX Modbus
//
from(bucket: "home_assistant")
  |> range(start: v.timeRangeStart, stop: v.timeRangeStop)
  |> filter(fn: (r) => r["_measurement"] == "W")
  |> filter(fn: (r) => r["_field"] == "value")
  |> filter(fn: (r) => r["domain"] == "sensor")
  |> filter(fn: (r) => r["entity_id"] == "solaxm_inverter_power")
  |> aggregateWindow(every: v.windowPeriod, fn: mean, createEmpty: false)
  |> yield(name: "mean")
Pending Items
I still need to study the configuration used by the Integration’s author.
I still need to explore other interesting monitoring options, as well as investigate the possibility of programming the Inverter from Home Assistant, although that’s something I’m quite cautious about for now…
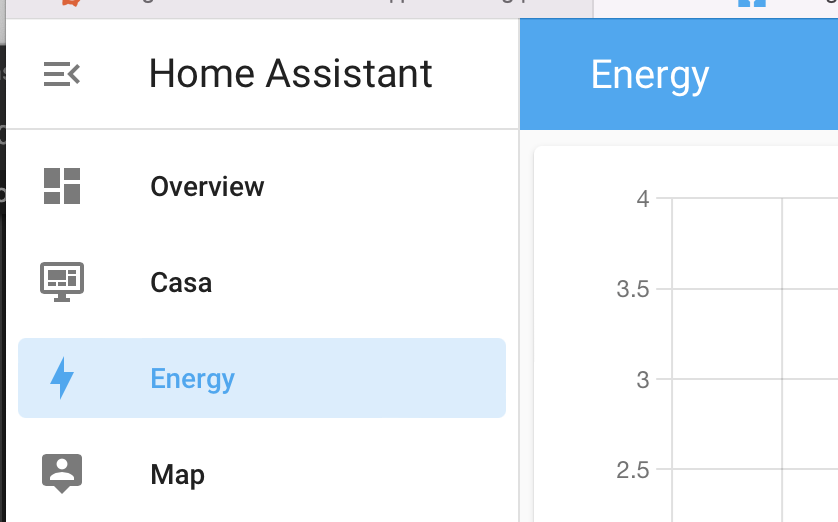
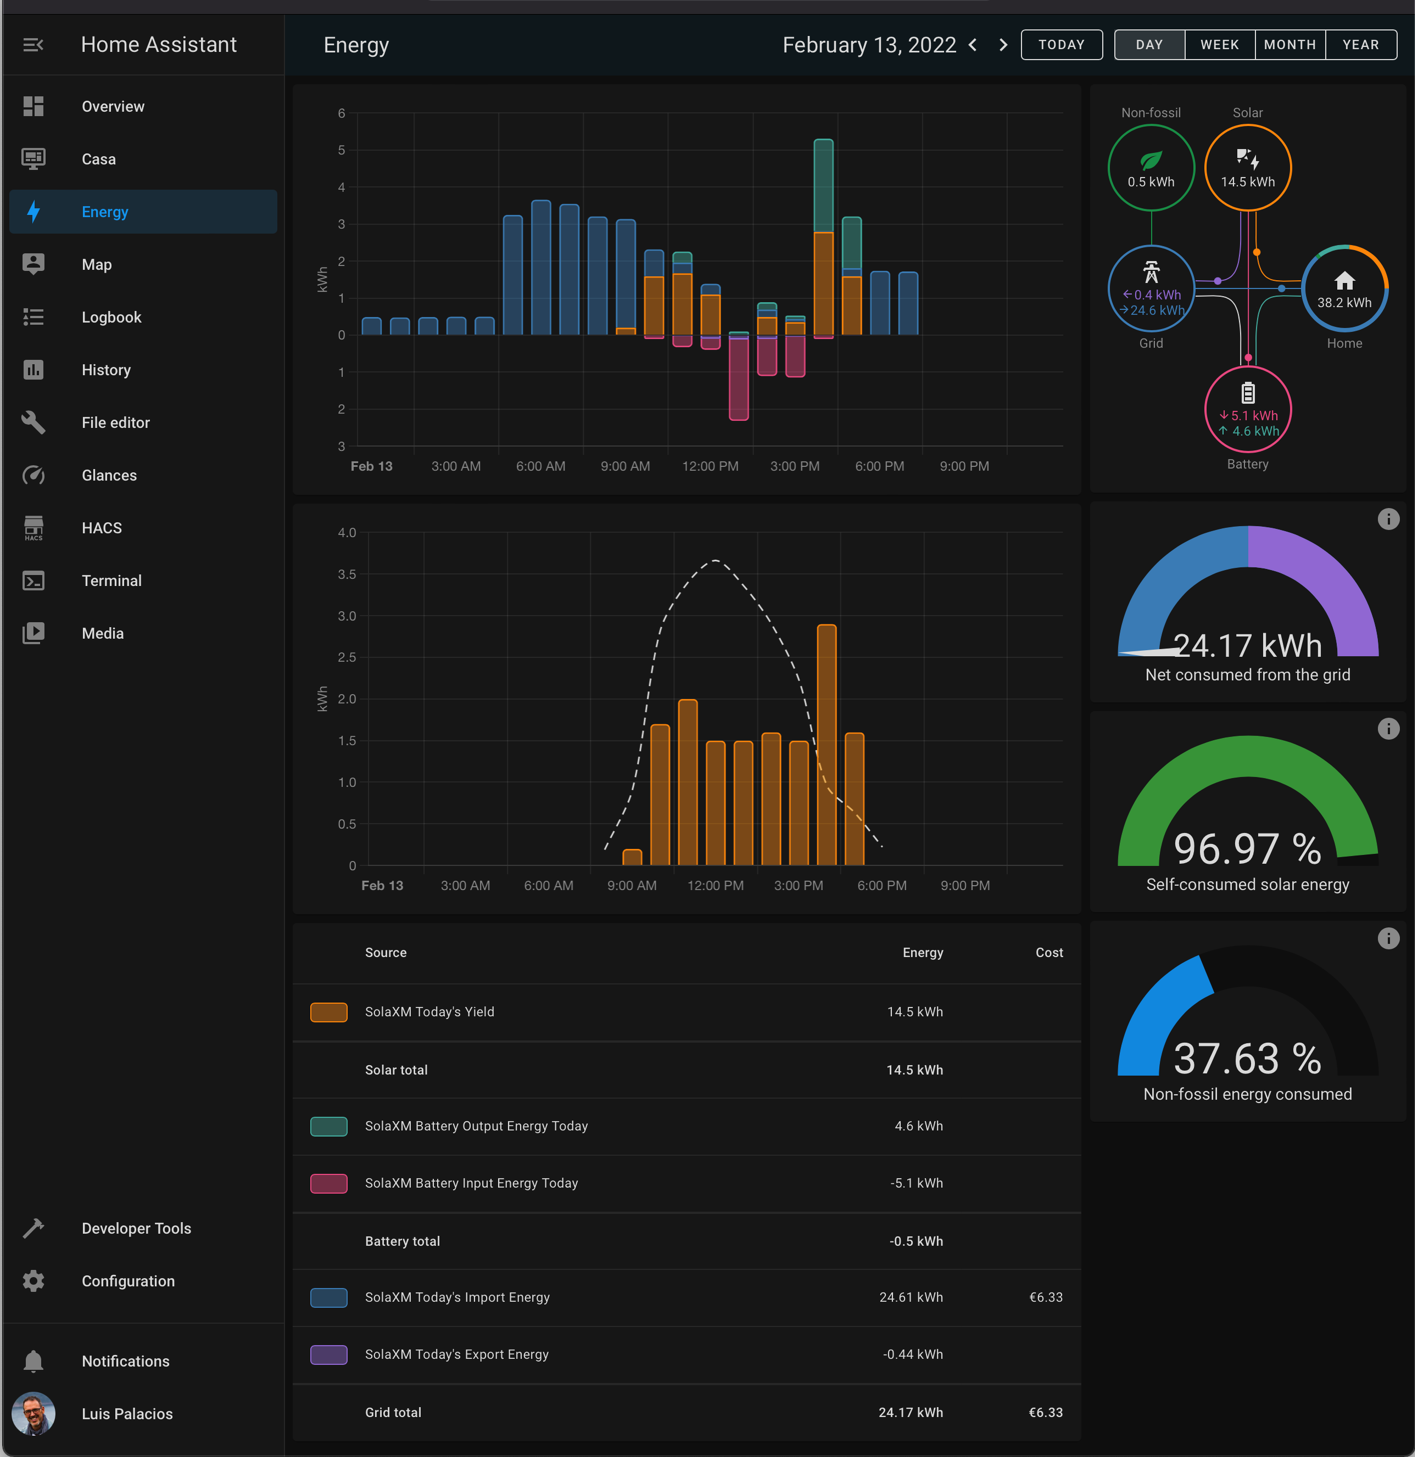
Energy Dashboard Integration
With version 2021.8, Home Assistant released the Energy Dashboard.
Its goal is to help users understand their energy consumption, allowing them to see at a glance how they’re doing today, with the option to drill down by hour to see what happened. It also includes indicators that help identify your grid dependency and whether adding energy storage would help.
There’s a way to make this integration’s data compatible with that Dashboard…
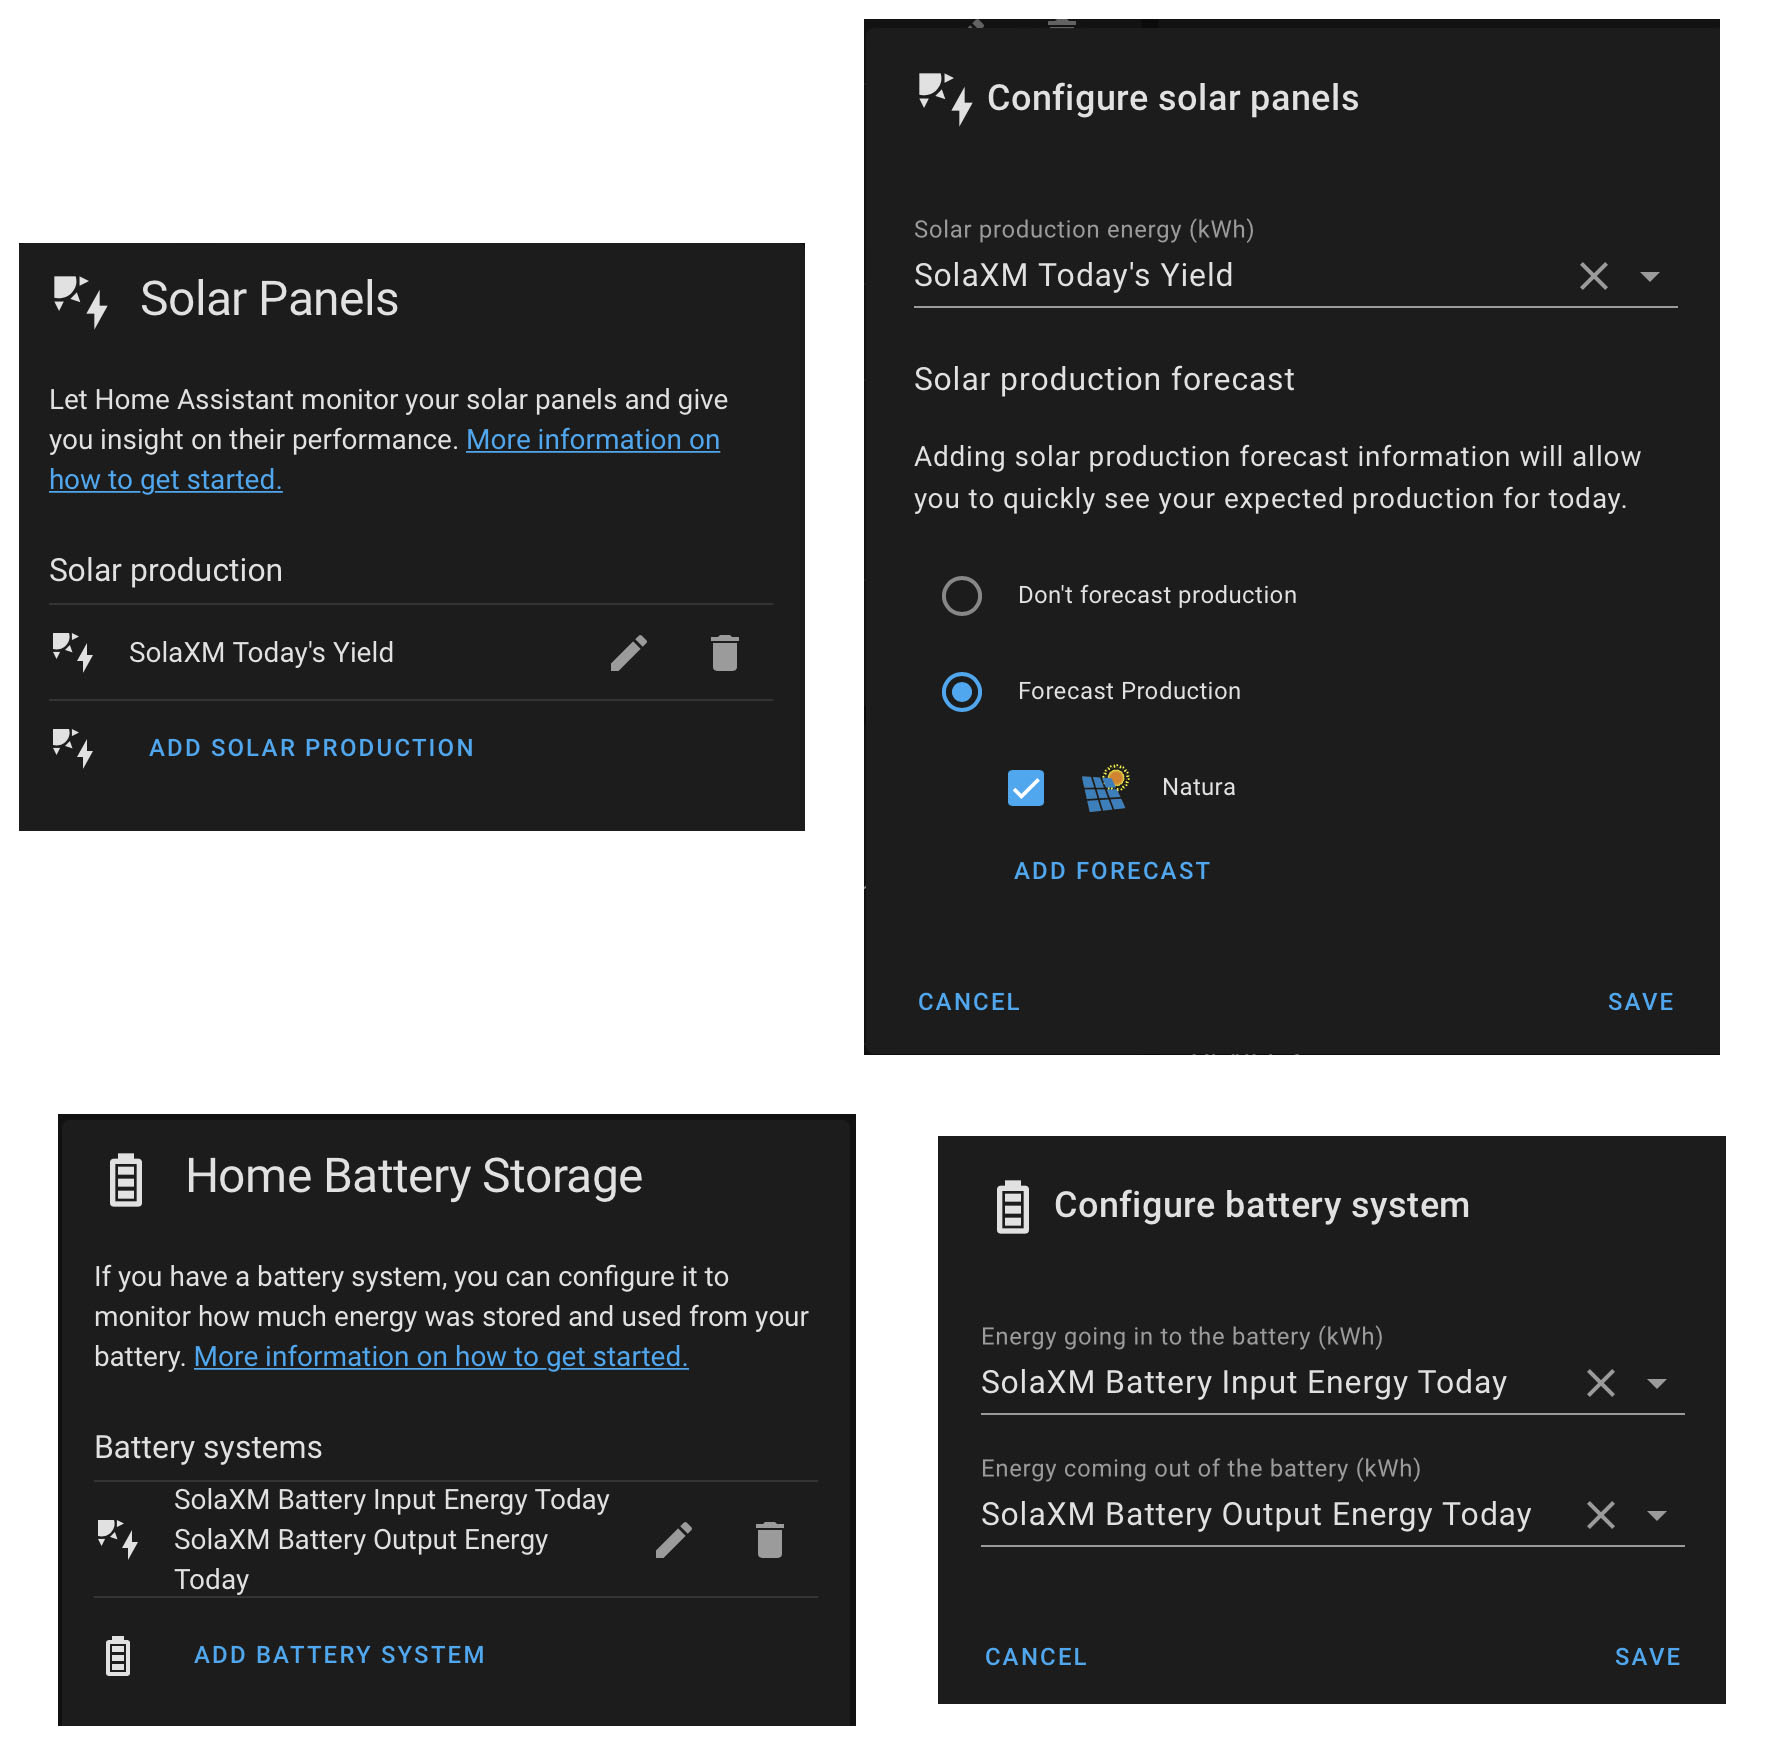
Initial Configuration
The documentation to configure the Energy screen is at this link.
| Note: If you’ve already done a configuration and can’t edit it from the Energy Dashboard, it’s because you can only edit it from Configuration > Dashboard > Energy. By the way, for reference, the configuration is saved in the file: config/.storage/energy |
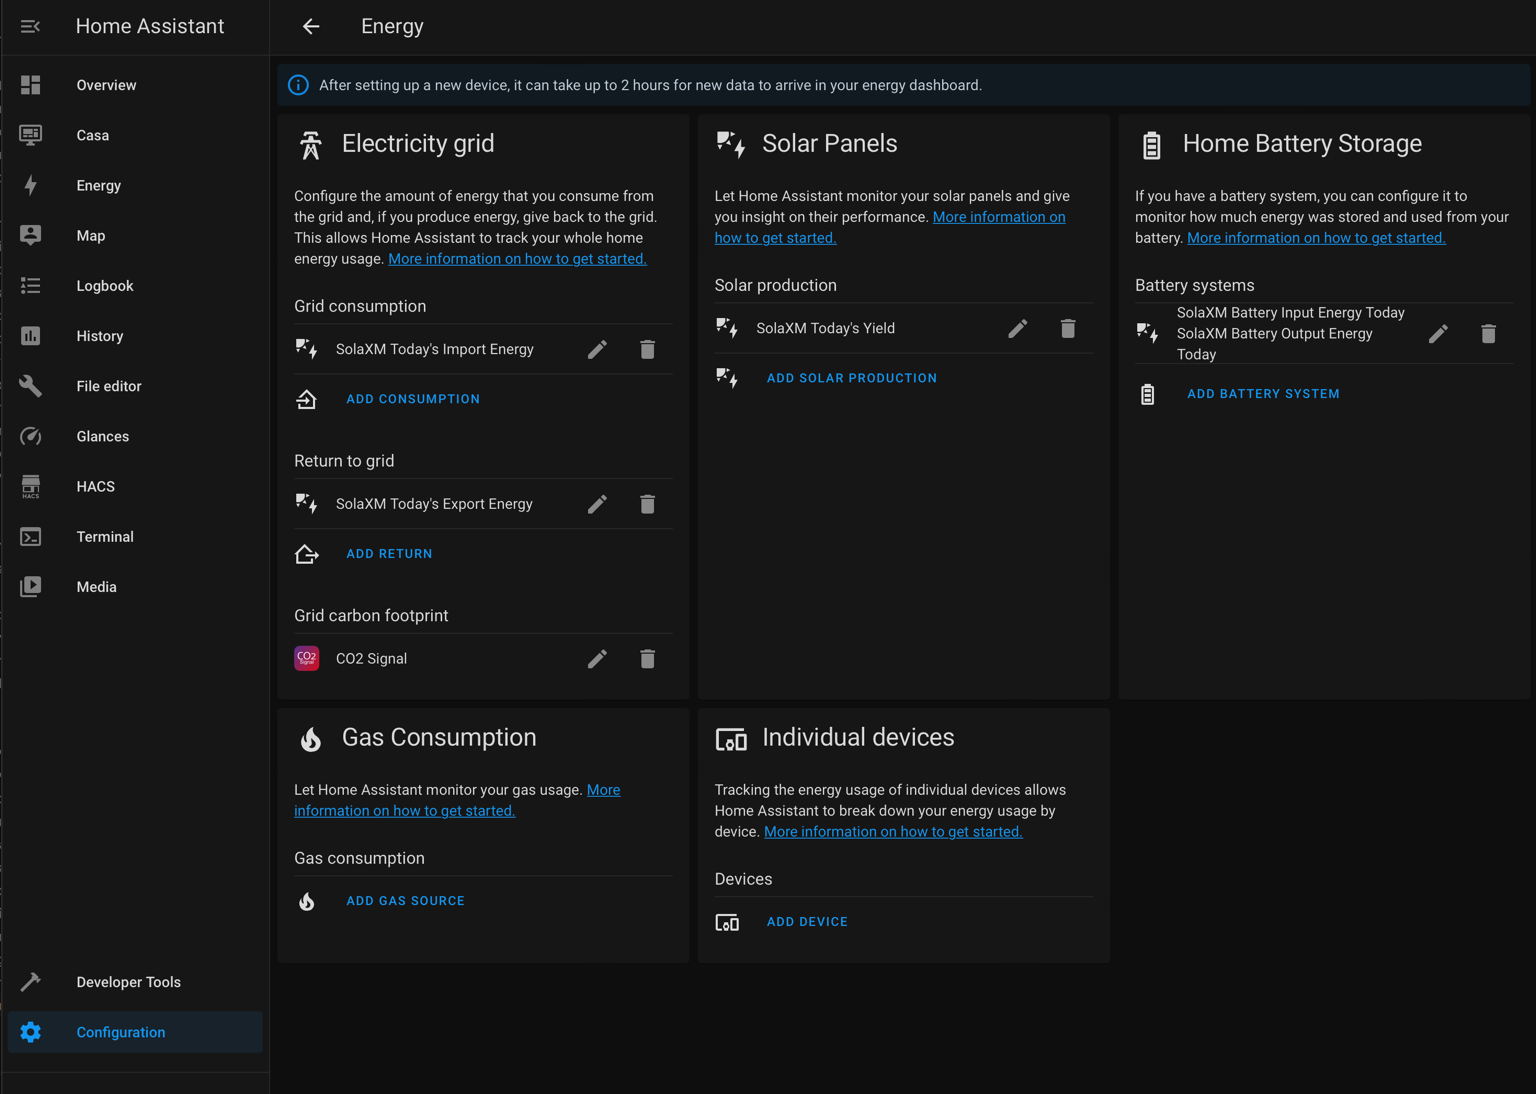
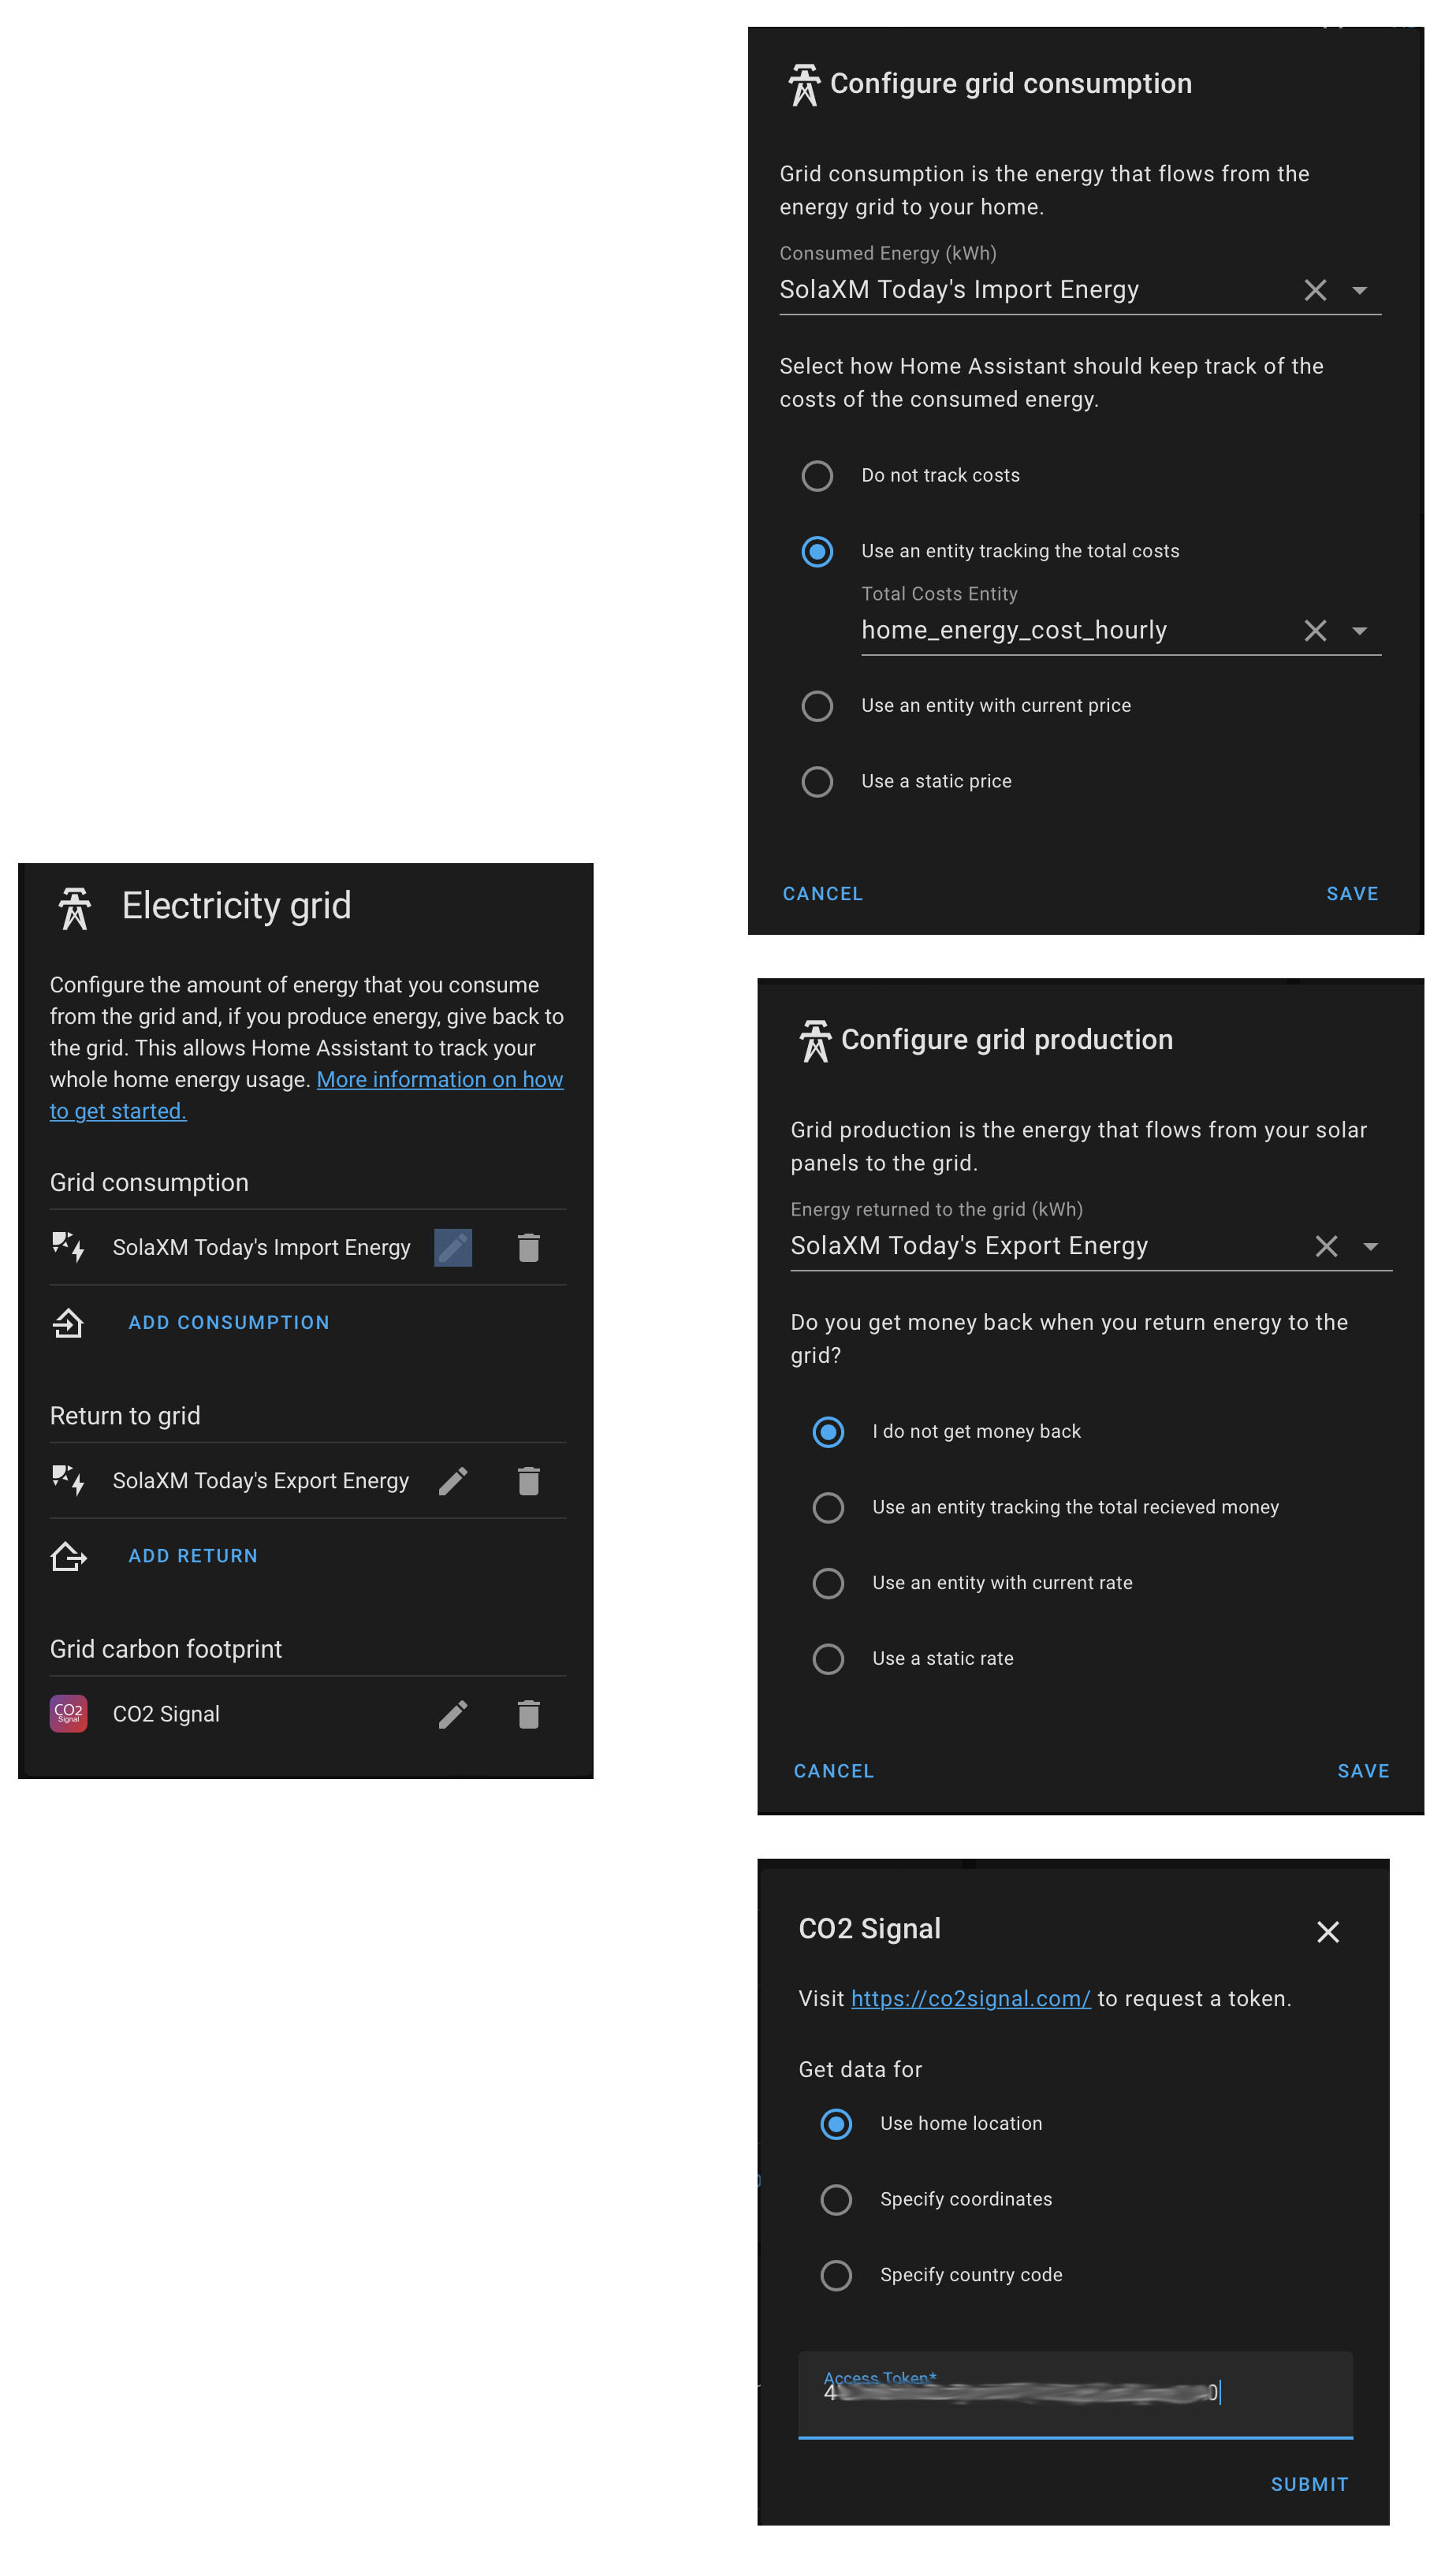
| Note 1: For CO2 Signal, just visit the site and sign up — they’ll send you your token. |
| Note 2: In the window where I define the grid consumption (SolaXM Today’s Import Energy) I’ve added an entity that tracks total costs, but it’s just a test — it’s not required. |
The end result is the Energy Dashboard.
Comparison with what we see in a custom Grafana Dashboard…