Multicast DNS (mDNS) is a networking protocol designed to resolve hostnames to IP addresses within small networks, without the need for a local DNS server. It requires no configuration (zero-configuration) and uses the same programming interfaces, packet formats and operational semantics as unicast Domain Name System (DNS).
It was designed to work as either a standalone protocol or alongside standard DNS servers. mDNS can work together with DNS Service Discovery (DNS-SD), a complementary zero-configuration networking technique specified separately in RFC 6763.
Introduction
If it requires no configuration, what’s the purpose of this post? To explain what mDNS is, understand how it works, why some devices in your home “see” each other, why they discover one another, the impact it has on tools like Home Assistant and home automation, and finally, to explain how to “see” what’s happening on your network – how to monitor mDNS.
What is mDNS? It uses IP multicast User Datagram Protocol (UDP) packets and is implemented by Apple’s Bonjour software packages and the open-source Avahi, included in most Linux distributions. While the Windows 10 implementation was limited to discovering network printers, later versions also resolved hostnames.
Let’s see how to deploy and monitor mDNS with Home Assistant and Grafana. Note that I’m only going to monitor a single VLAN in my home – I don’t need more. If you needed to monitor multiple VLANs, you’d have to configure an mDNS reflector on your network. I won’t cover that here. The first thing I’ll configure is Avahi.
Avahi
Avahi is an open-source service for Linux that implements mDNS (Multicast DNS) and DNS-SD (DNS Service Discovery). It’s the Linux alternative to Bonjour, Apple’s protocol for device discovery. I install it on my main router. I update the operating system, take the opportunity to reboot it, and then install it.
[root]@cortafuegix:~# apt update && apt upgrade -y && apt full-upgrade -y
[root]@cortafuegix:~# apt autoremove -y --purge
[root]@cortafuegix:~# systemctl reboot -f
:
[root]@cortafuegix:~# apt install avahi-daemon avahi-utils
I configure Avahi for VLAN 100 by editing the configuration file:
[root]@cortafuegix:~# nano /etc/avahi/avahi-daemon.conf
I make sure to have these lines:
[server]
allow-interfaces=lo,vlan100

[reflector]
enable-reflector=no
I restart Avahi to apply the changes:
[root]@cortafuegix:~# systemctl restart avahi-daemon
[root]@cortafuegix:~# systemctl status avahi-daemon
● avahi-daemon.service - Avahi mDNS/DNS-SD Stack
     Loaded: loaded (/lib/systemd/system/avahi-daemon.service; enabled; vendor preset: enabled)
     Active: active (running) since Sat 2025-03-08 09:31:16 CET; 10s ago
TriggeredBy: ● avahi-daemon.socket
   Main PID: 3652 (avahi-daemon)
     Status: "avahi-daemon 0.8 starting up."
      Tasks: 2 (limit: 3430)
     Memory: 1004.0K
        CPU: 12ms
     CGroup: /system.slice/avahi-daemon.service
             ├─3652 "avahi-daemon: running [cortafuegix.local]"
             └─3653 "avahi-daemon: chroot helper"

mar 08 09:31:16 cortafuegix avahi-daemon[3652]: No service file found in /etc/avahi/services.
mar 08 09:31:16 cortafuegix avahi-daemon[3652]: Joining mDNS multicast group on interface vlan100.IPv4 with address 192.168.100.1.
mar 08 09:31:16 cortafuegix systemd[1]: Started Avahi mDNS/DNS-SD Stack.
mar 08 09:31:16 cortafuegix avahi-daemon[3652]: New relevant interface vlan100.IPv4 for mDNS.
mar 08 09:31:16 cortafuegix avahi-daemon[3652]: Joining mDNS multicast group on interface lo.IPv4 with address 127.0.0.1.
mar 08 09:31:16 cortafuegix avahi-daemon[3652]: New relevant interface lo.IPv4 for mDNS.
mar 08 09:31:16 cortafuegix avahi-daemon[3652]: Network interface enumeration completed.
mar 08 09:31:16 cortafuegix avahi-daemon[3652]: Registering new address record for 192.168.100.1 on vlan100.IPv4.
mar 08 09:31:16 cortafuegix avahi-daemon[3652]: Registering new address record for 127.0.0.1 on lo.IPv4.
mar 08 09:31:17 cortafuegix avahi-daemon[3652]: Server startup complete. Host name is cortafuegix.local. Local service cookie is 108695492.
Home Assistant
Home Assistant (HA) is an open-source home automation platform designed to centralize the control of smart devices. It integrates a wide variety of devices and protocols (such as Zigbee, Z-Wave, MQTT, HomeKit, and more) into a single interface, making it easy to manage lights, sensors, cameras, thermostats and other IoT devices. Its modular architecture and compatibility with over 2,000 integrations make it a flexible solution for both home users and automation enthusiasts. Additionally, Home Assistant can run on a Raspberry Pi, a Linux server, or as a virtual machine in Proxmox or Docker.
HA comes with mDNS/Bonjour enabled and natively supported, so all you need to do is make sure you can see it and that it can see other devices on the network.
- From a browser you should be able to connect to http://homeassistant.local:8123/, which means its mDNS implementation is working.
- Go to Settings > Devices & Services. If it discovers any new device, it will show up there.
You can verify it’s visible from Linux with this command:
avahi-browse -alr
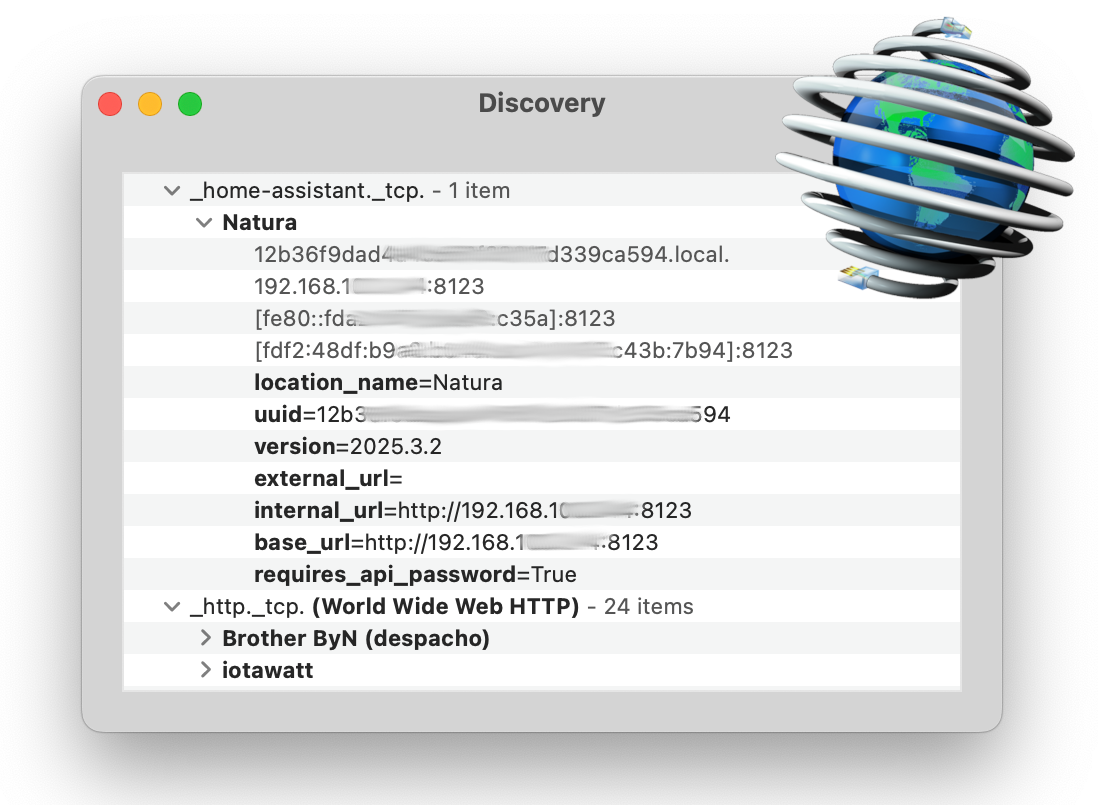
If you have a Mac, install the free app Discovery - DNS-SD Browser, which in my opinion is the best tool out there. It shows all available Bonjour services on the local network. Great for viewing and debugging your own developments. It detects computers connected to your network or simply lets you know which services are available. Perfect for network admins or developers.
Monitoring mDNS with Grafana
Grafana is an extremely powerful data visualization and monitoring platform that lets you create interactive dashboards from various data sources such as Prometheus, InfluxDB, MySQL, and more. It’s widely used in observability and performance analysis environments, allowing you to represent metrics in dynamic, customizable graphs. Its ability to configure alerts and explore data in real time makes it ideal for monitoring IT infrastructure, IoT devices, and networks. In my case, within the Home Assistant context, I use Grafana alongside InfluxDB to visualize historical sensor data and home events.
To visualize the mDNS devices and services on the home network, I’m going to use the mdns-scan tool on Linux as a collector and send the data periodically to InfluxDB.
- Capture mDNS queries with
mdns-scan(from the Linux machine where I installed Avahi) - Store the data in a log file
- Send the data to InfluxDB
I install mdns-scan with:
[root]@cortafuegix:~# apt install mdns-scan
Capturing and storing the data. First I’ll do a manual scan – this command may take a while to finish:
mdns-scan | tee -a /var/log/mdns.log
To automate the scan every 5 minutes, add a cron task:
crontab -e
Add this line:
*/5 * * * * mdns-scan | tee -a /var/log/mdns.log
Sending data to Prometheus (if you use it)
If you use Prometheus, you can set up a custom exporter to expose mDNS data via HTTP so Prometheus can collect it.
If you use InfluxDB, the logs can be sent directly to an InfluxDB bucket.
Visualizing in Grafana
- Open Grafana:
http://tu-ip-grafana:3000. - Add Prometheus or InfluxDB as a data source.
- Create a dashboard with:
- A table panel to show active mDNS services.
- A time series panel to track the availability of mDNS services over time.
To install Golang on Linux, check the latest version on their website, add /usr/local/go/bin to your PATH (an example from my ~/.zshrc).
# As root
wget https://go.dev/dl/go1.24.1.linux-amd64.tar.gz
rm -rf /usr/local/go && tar -C /usr/local -xzf go1.24.1.linux-amd64.tar.gz
I download the FOSS project go-mdns-scan (an alternative written in Go):
🎯 luis@cortafuegix:~ ❯ git clone https://github.com/brutella/dnssd.git
:
🎯 luis@cortafuegix:~ ❯ cd dnssd
🎯 luis@cortafuegix:dnssd (master) ❯ go build
:
Conclusion
- Avahi configured on VLAN100 to handle mDNS.
- Home Assistant automatically detecting devices.
- Grafana monitoring mDNS queries and services.